PART 9: CO-LOCALISATION ANALYSIS
For fluorescent images we can examine whether two fluorophores (hence; two proteins of interest) are interacting by using co-localisation analysis.
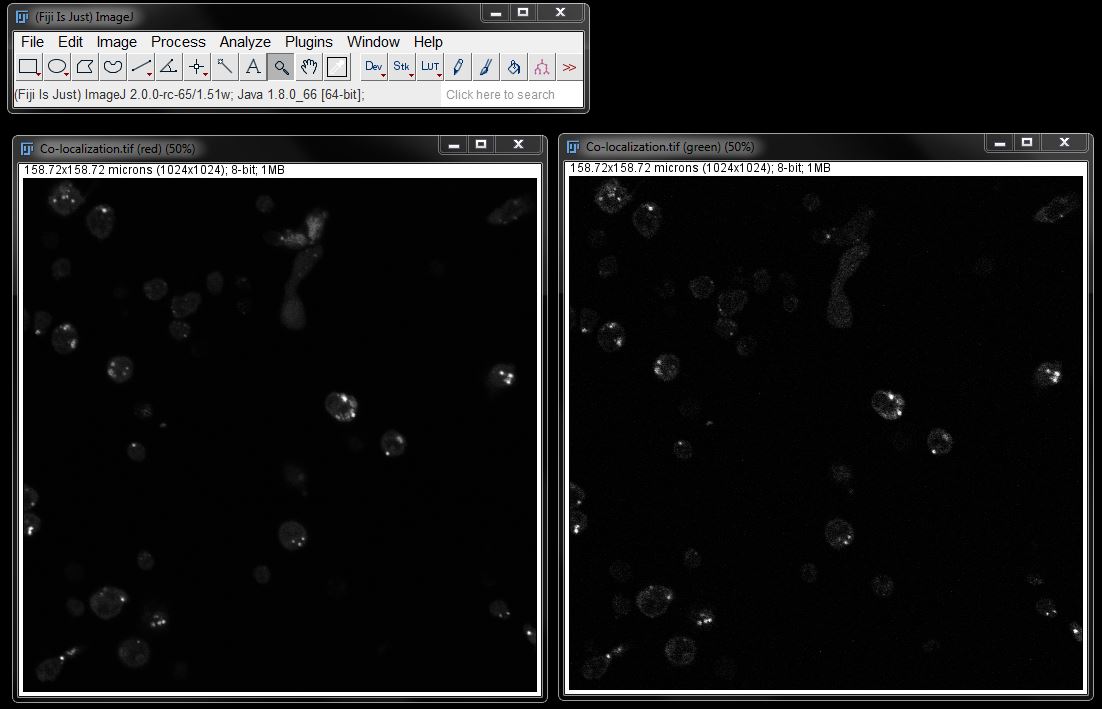
In this section we use the image Colocalisation.tif for demonstration.
Important Considerations
It is important to remember that co-localisation analysis is not an exact measurement, and numerous factors can alter the outcome of your analysis. Before you undertake co-localisation analysis there are several important factors that need to be considered.
Resolution and the Limitations of the Microscope: Resolution refers to the ability to distinguish two seperate objects as seperate. The size of proteins and fluorophores wihtin your cells will be smaller than the resolution limitations on a light microscope (widefield or confocal) as such two tagged proteins that are not actually occupying the same space but are close can appear to be co-localised, simply becasue they could not be resolved. The higher the resolution of an image, the more accurate the result will be, with super-resolution images being the highest standard for determining true co-localisation.
The Size of Antibodies and Tags: Antibodies and fluorescent tags are bigger than you might expect. The addition of an antibody (or antibodies) or fluorescent tag to your protein of interest can add considerable size and it is important to remember that we are viewing that fluorescent marker with our imaging, not the protein of interest directly. As such, two fluorescent markers sitting side by side or even within the same space may not neccessarily mean that your two proteins also overlap. There may still be considerable distance between proteins that is being occupied and diminished by the size of the antibodies or tags.
Spectral Overlap: Although fluorescent markers have a 'peak' emission the actual emission spectrum often has a long tail. This means that it can also be detected at a higher wavelength, often overlapping with a fluorphore in the next 'colour' range. Therefore it is important to select your fluorescent markers carefully when imaging for co-localisation to ensure minimal spectral overlap. It is also important use image acquisition parameters that minimise the potential for any overlap (such as sequential scanning on a confocal microscope). Failure to do this may mean your "co-localistation" is simply the same dye being imaged in both channels.
Acquisition Parameters and Differences in Fluorophores: As co-localisation analysis is based on intensity it is important to ensure that all acqusiton parameters remain equal between images. It is also important to keep in mind that different dyes and fluorophores have quite different parameters that can effect imaging and subsequent analysis. There is no way to avoid these differences, but you can try to minimise variations by following the same protocols and imaging parameters each time if possible.
Co-localisation Analysis Algorithms
This workshop will concentrate on two different algorithms to calculate co-localization: Manders and Pearsons.
Manders…
…thresholds both images and calculates how many pixels above threshold in channel 1 are also above threshold in channel 2 and vice versa. You get two Manders coefficients, one for channel 1 and one for channel 2. Values will range between 1, for complete co-localization i.e. all channel 1 pixels above threshold are also above threshold in channel 2, and 0, for no co-localization i.e. no channel 1 pixels above threshold are above threshold in channel 2.
Pearsons…
…takes into account the fluorescence intensity of each pixel. If all bright pixels in channel 1 are also bright in channel 2, and all dim pixels in channel 1 are also dim in channel 2 then the Pearsons coefficient is 1. If there’s no co-localization, i.e. fluorescence intensities are randomly distributed in channel 1 and 2, then the Pearsons coefficient is 0. The two channels can also be anti-correlated, which means that all bright pixels in channel 1 are dim in channel 2, and vice versa. In other words, where there’s green signal, there is no red signal. In this case, the Pearsons coefficient is -1. Pearsons co-localization does not require thresholding and is therefore more robust than Manders. It also provides you with more information as fluorescence intensity is being taken into account and you get information on anti-correlation.
Co-localisation Analysis
FIJI has a co-localisation plugin available that will allow you to carry out analysis in a few steps.
To begin analysis, open the demo image Colocalization.tif and split channels. We only need the red and green channels here, so close the image for the blue channel.
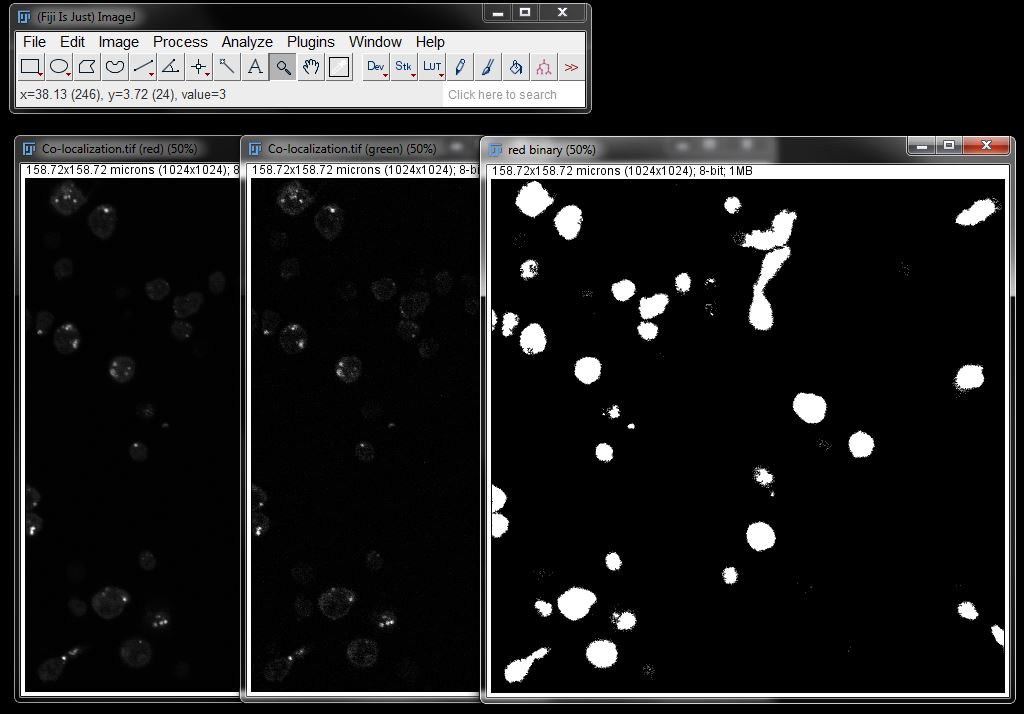
Our first step is to create a binary of the red channel to allow the plugin to separate the cells from the background. To do this, first duplicate the red channel, then threshold and create a mask/binary of the duplicate. Make any neccessary adjustments to your binary to ensure accurate representation of the cells.
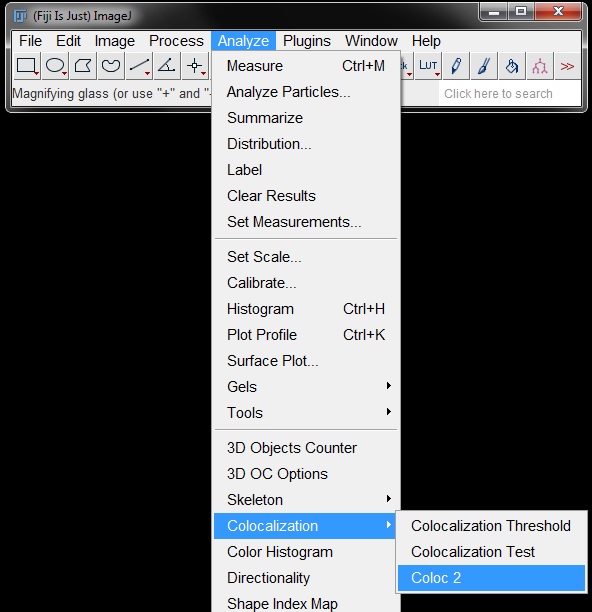
Go to Analyze -> Colocalization -> Coloc2.
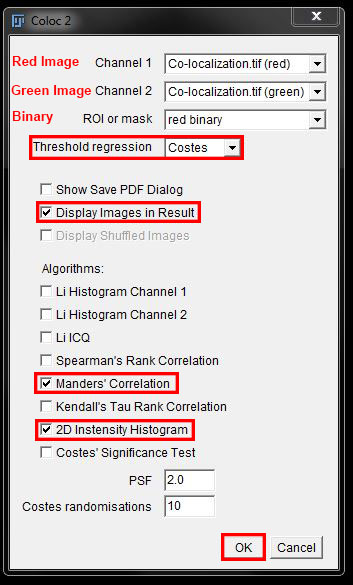
In the options window, choose the red image as channel 1, the green image as channel 2, and your mask/binary as mask from the drop down menus. Coloc2 will use autothresholding to calculate the Manders coefficients, leave this option as the default Costes method. Tick on the following options (if not already on by default): Display Images in Result, Mander's Correlation, 2D Instensity Histogram. Leave the PSF and Costes randomisations at 2 and 10 respectively.
Once your options are set, click on OK to begin the calculation.
After calculation, a results window will open, containing a graph and a table of values.
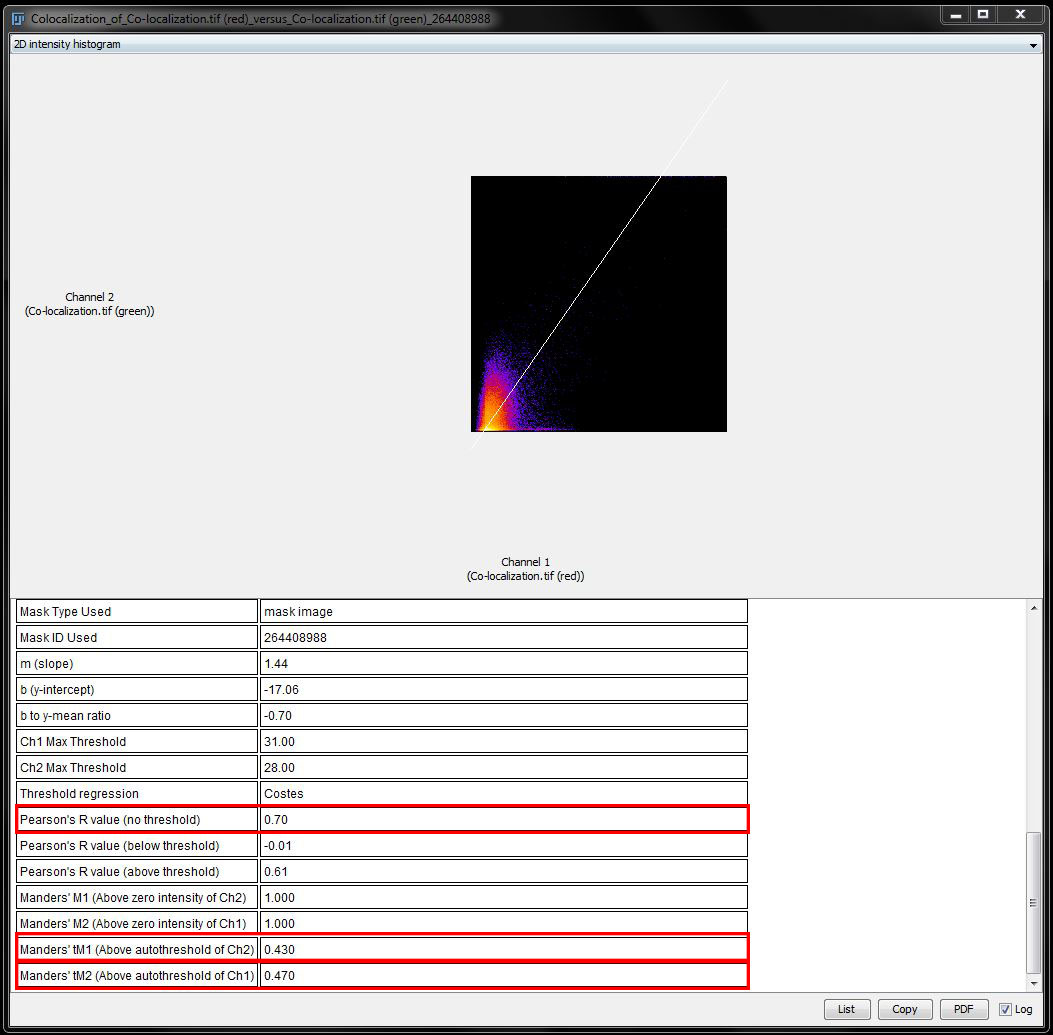
Let’s try to understand these values. Manders coefficients without thresholds is 1. That will be the case for almost all images and just means that there is some kind of signal in all pixles. Not useful!
Manders with thresholds is better: we have a Manders coefficient of 0.43 for the red channel and 0.47 for the green channel. That means that inside the mask, 43% of the red pixels are also green, 47% of the green pixels are also red.
Pearsons coefficient without threshold is 0.70, which means the signal in both channels is correlated, the above and below values are not really crucial, but a nice control. Above threshold is also correlated, while below threshold is randomly distributed.
The scatter plot shows fluorescence intensity of one channel on the x-axis and fluorescence intensity of the other channel on the y-axis. Correlated or co-localized signal will show up along the white line.