PART 2: MULTIPLE DIMENSIONS
Our images often contain more than just a single flat picture. We can have multiple colour channels, introduction of the z-plane (3D), time series, or any combination of the above. In all of these case your data may be displayed in an image stack. In FIJI Basics we went through how to navigate and alter an image stack. Those instructions can be easily applied to images with a single multiple dimension of any kind (eg: z-stacks only), but when we add in more than 1 extra demmension (eg: z-stacks AND time series) we also need expand on our toolset to allow us to present the data in in the most accurate and effective way possible. Here we will show you more tools for working with your multi-dimensional (3D, time series, 4D) image stacks.
In this section we use Spheroid.tif for 3D and MovieStack.tif for time series. HyperStack.tif will also be used for demonstration.
3D Projections - Method 1
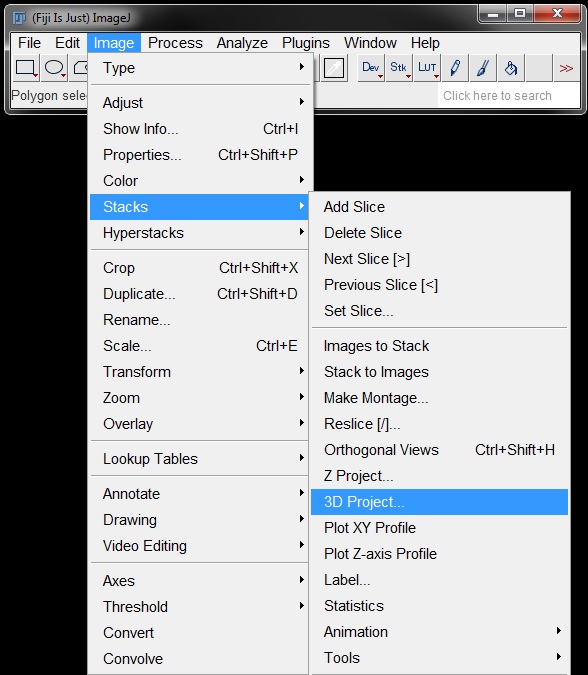
When working with z-stacks, you can create a 3D projection of the stack by going to Image -> Stacks -> 3D Project.
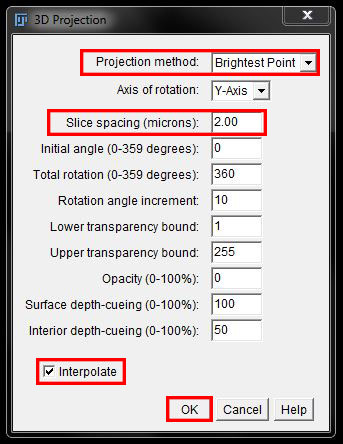
For most 3D projections you can leave the settings in the 3D Projection window as default.
The Projection Method should be Brighest Point by default. If it isn't, change it from the drop down menu.
If the image is calibrated the Slice spacing should be populated correctly from the metadata, but sometimes will need to be entered manually. Here we need to enter a step size of 2 microns.
Note: The slice spacing is the z-step size used during image capture, not the calibration size.
If you check the box next to Interpolate, FIJI will 'guess' the image information between slices and fill in the blanks. While this helps to create a smooth projection it is adding information that is not in the original image. For quantitation this should never be used, however, for presentation of your 3D projection you can use it to create a nicer image.
Select OK to create the projection.
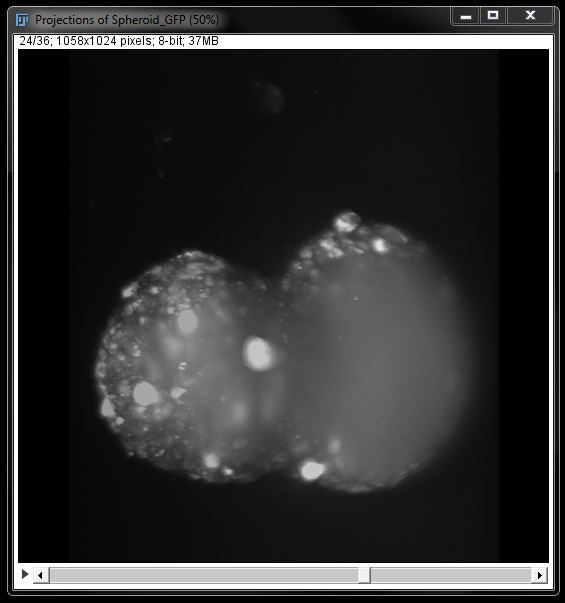
The resulting projection will have a slider at the bottom (similar to a stack) which you can use to rotate the 3D image.
3D Projections - Method 2
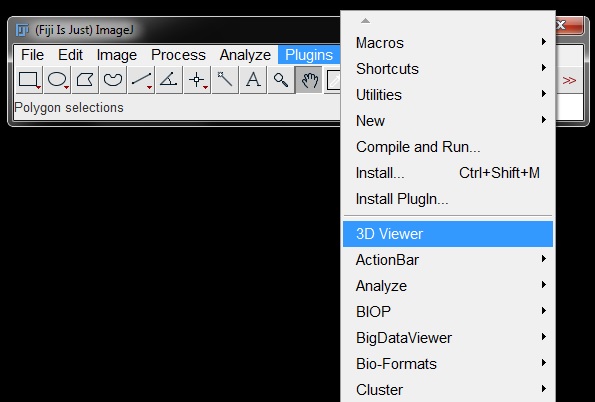
You can also create a volume view of your z-stack using a different 3D projection tool. Find this tool under Plugins -> 3D Viewer.
Select the image you want to project from the first drop down menu. You can give the projection a new name if you want to, or leave the default. Leave Volume (default setting) as the display type but ensure you change the Resampling factor from the default of 2 back to 1 so that no data is cut out of your image.
Note: There is now section in these settings to alter the z-step size. You must have a calibrated image, or have calibrated the z-step size in elsewhere first.
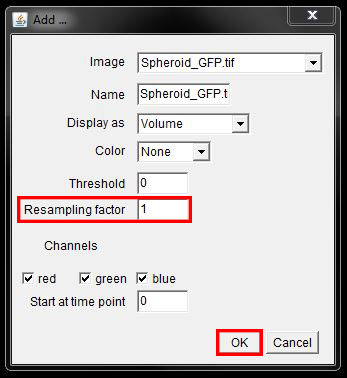
Select OK to create your 3D volume.
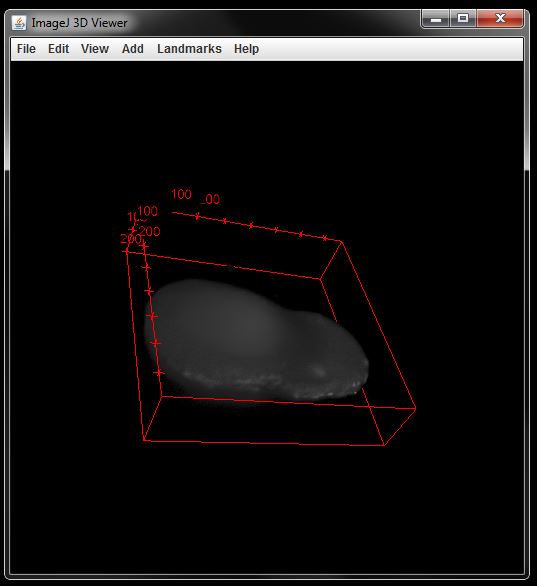
You can click and drag on the image to navigate around the volume.
Orthogonal Views
An orthogonal projection is a view created in the YZ or XZ dimension of an image stack. An orthogonal projection allows you to visualise depth information one slice at a time in your sample.
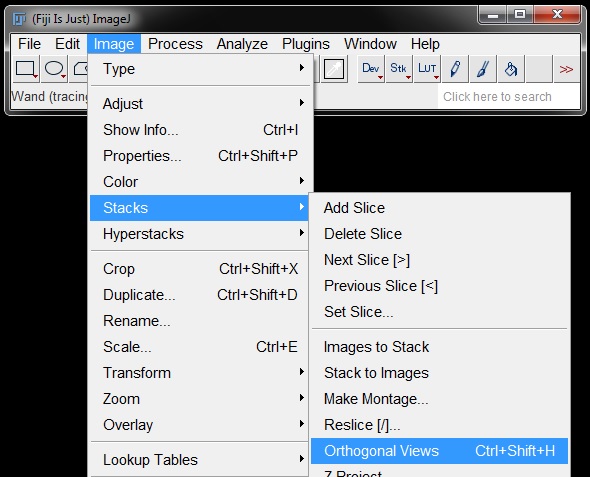
To generate orthogonal slices select your z-stack and go to Image -> Stack -> Orthogonal View (or use shortcut Ctrl+Shift+H).
Two windows will open to the right of and below the original stack. These windows show the orthogonal projections in YZ and XZ respectively.
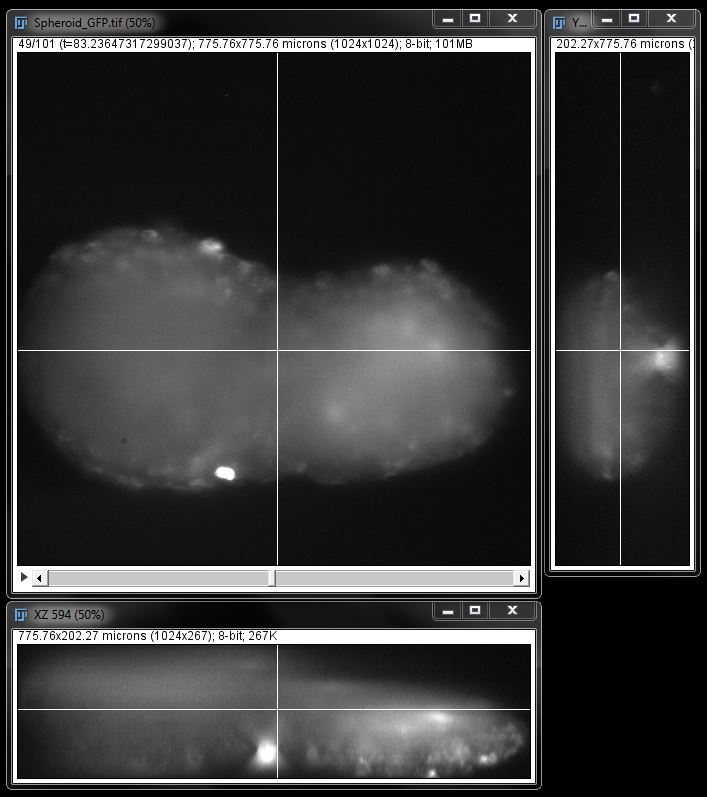
To change the view seen in each window, move the cross hair in the original stack to change positions and scroll through the stack to change planes.
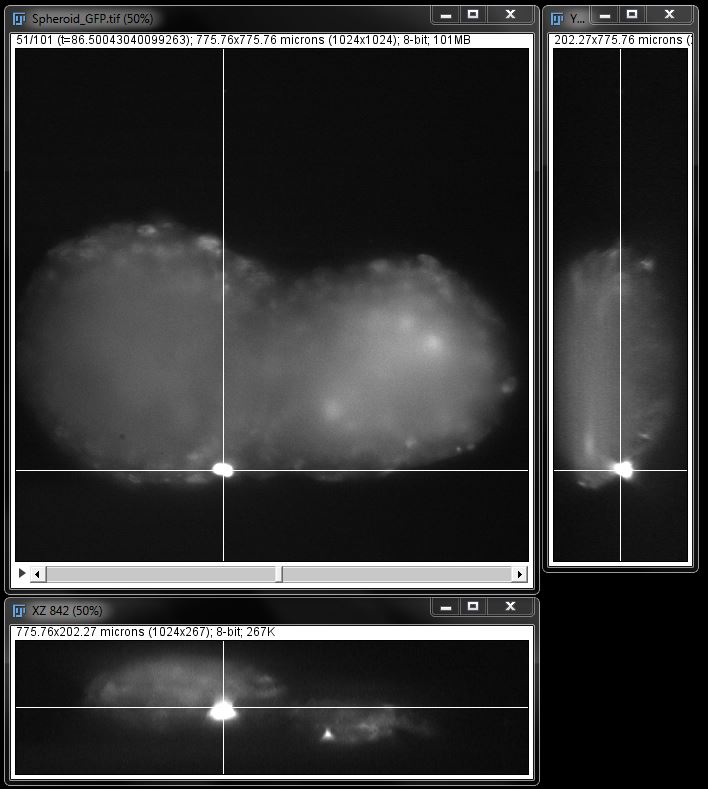
Each of these projections can be saved as tiff images for use later.
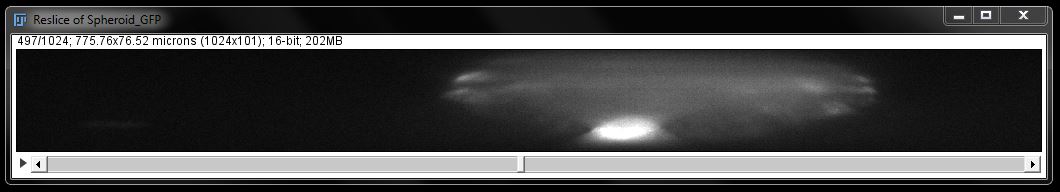
Reslice Z
The orthogonal projection only lets you see one slice at a time and it has the overlay lines in the way. For this reason it can be useful to generate a new stack of orthogonal views instead. This is easily achieved by reslicing the stack along a different axis.
To generate an orthogonal stack go to Image -> Stacks -> Reslice.
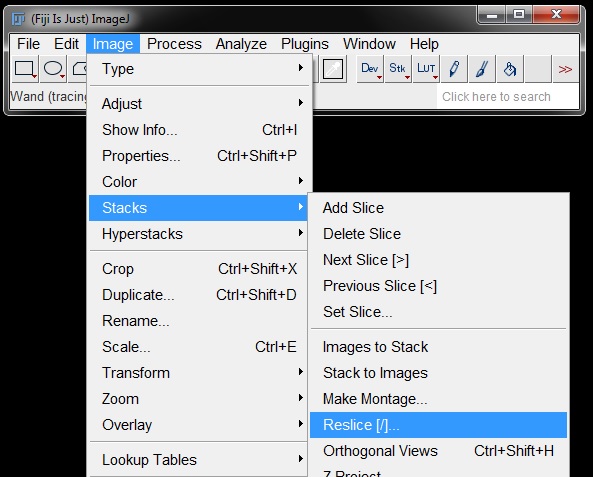
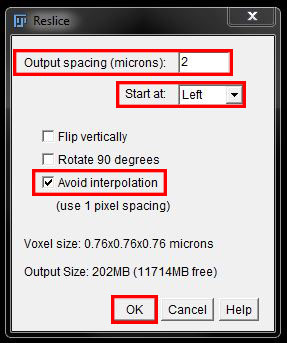
In the window that opens you can set the distance between slices, if not already calibrated (again enter 2 here), and chose how the stack should be resliced (top, bottom, left, right) from the drop down menu.
There is a tick box to select that says Avoid Interpolation. This should usually be ticked. As with the 3D projection, while interpolation will make the end result look better, it does this by adding extra data that wasn’t in the original image.
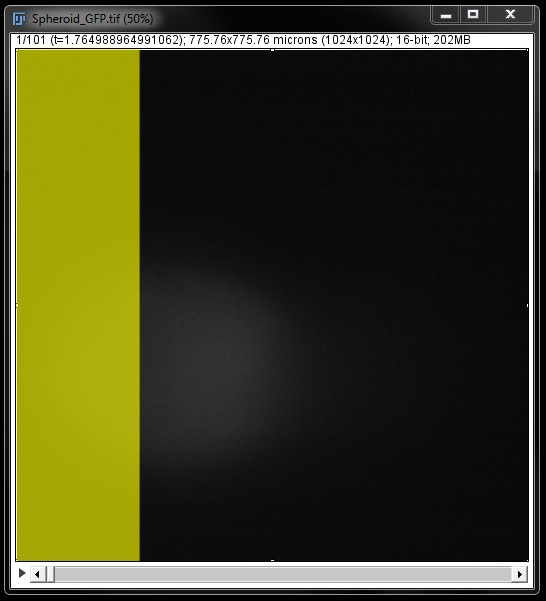
Select OK to generate the resliced stack.
The program will then ‘scan’ through the image from the selected direction and generate the new stack.
Times Series and Saving Movies
Time series will also open as a stack that you can work with in a similar manner to colour or z-stacks.
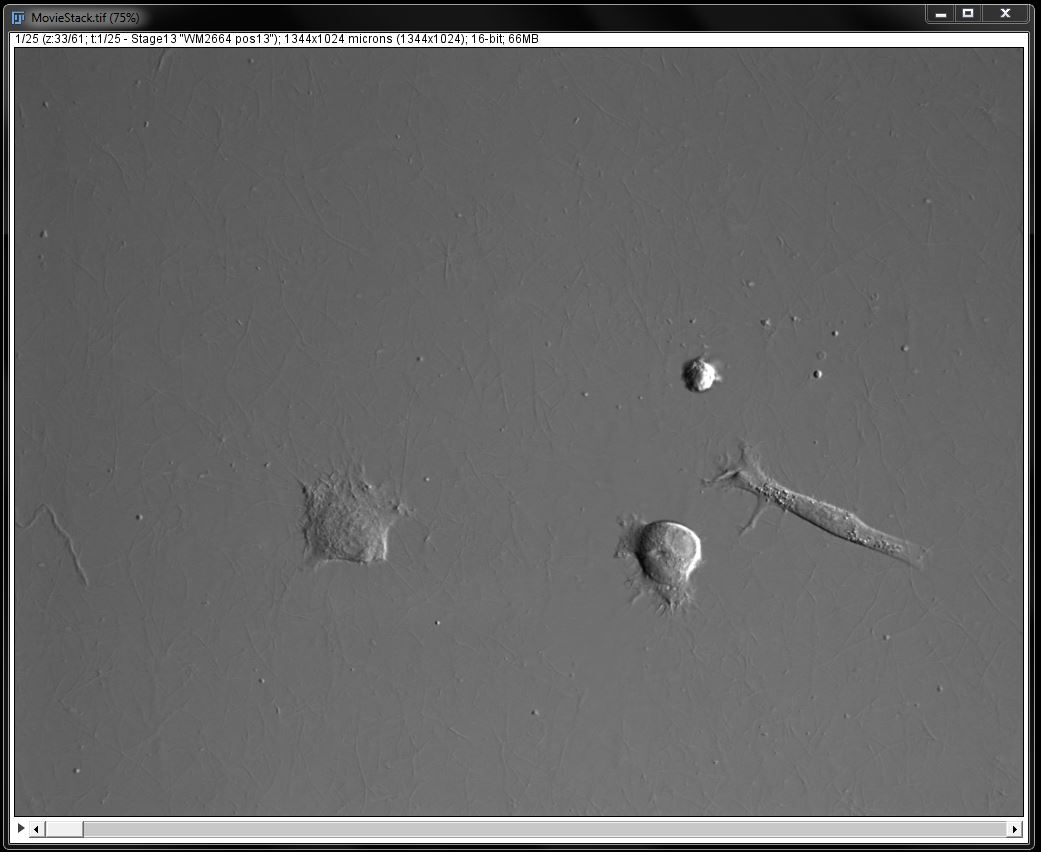
Here, the slider or play button move through the time points, rather than the channels or z-slices.
You can save your time series as a movie using FIJI by selecting File -> Save As, and choosing AVI as the file type.
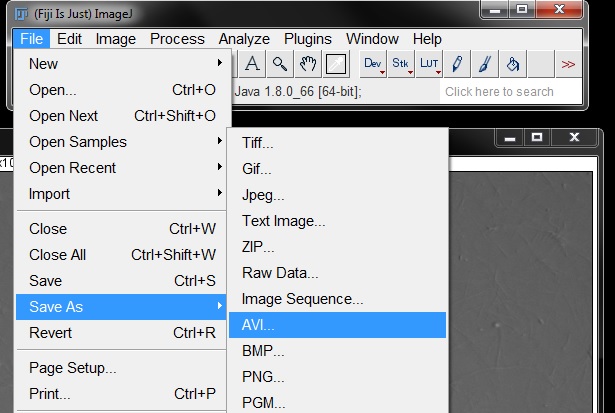
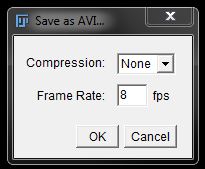
A window with saving options will open, which will allow you to set specific aspects of the movie.
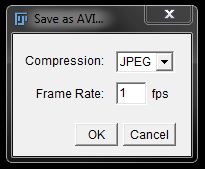
Where possible you should create your movie without compression (chose 'None' from the drop down menu under Compression). The ideal frame rate will be dependent on your images and time interval (ie: the fewer frames in the movie, the slower the frame rate should be). Sometimes a trial an error of different frame rates will be needed to generate a movie that plays at an appropriate speed. For this example we can use a frame rate of 8 frames per second (fps).
Click OK to create and save the movie. A movie file will be generated.

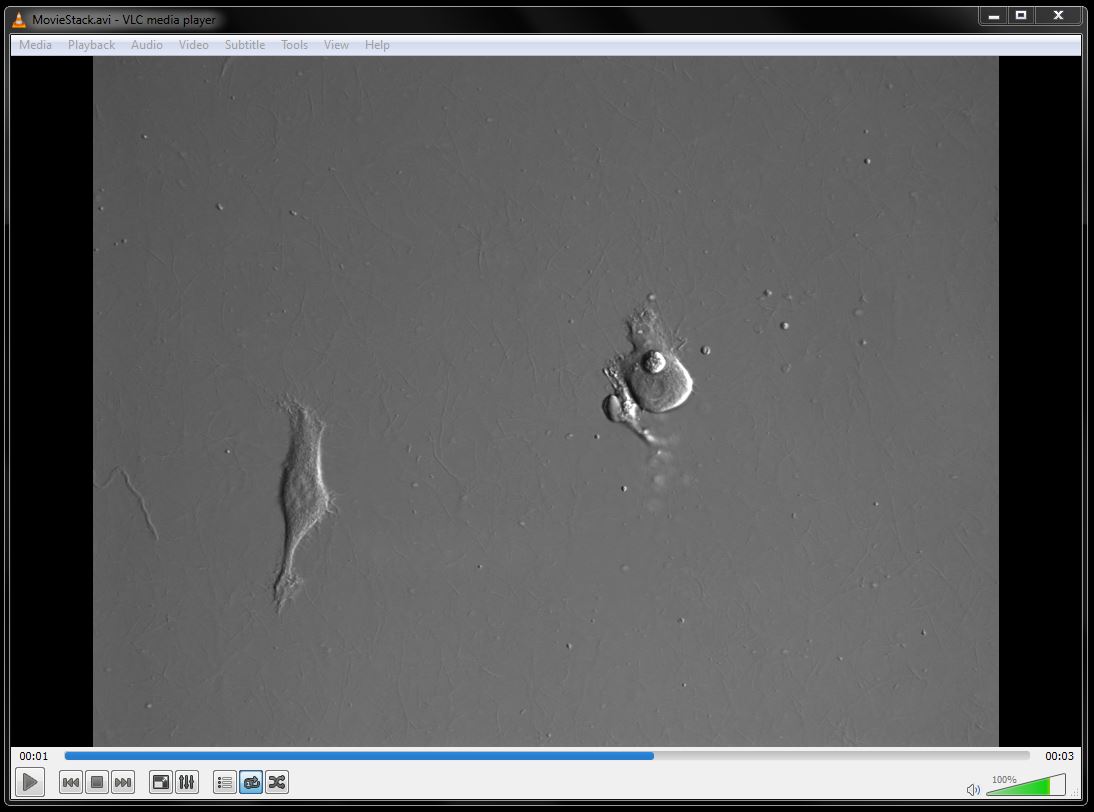
The movie will not open and play automatically after saving. You can open and play the movie file in programs such as QuickTime, Windows Media Player or VCL Media Player to check the frame rate. Repeat the process if a faster or slower rate is required.
Adding a Time Stamp and Scale Bar to Movies
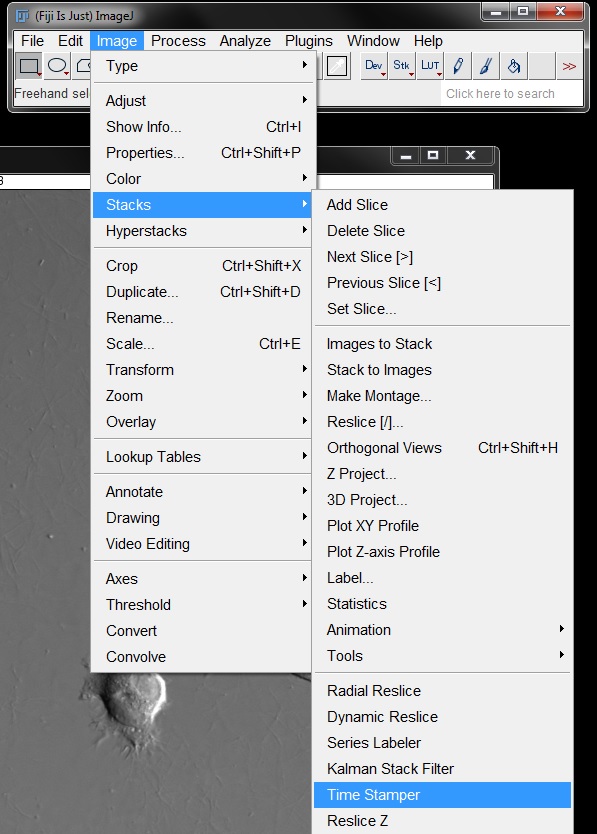
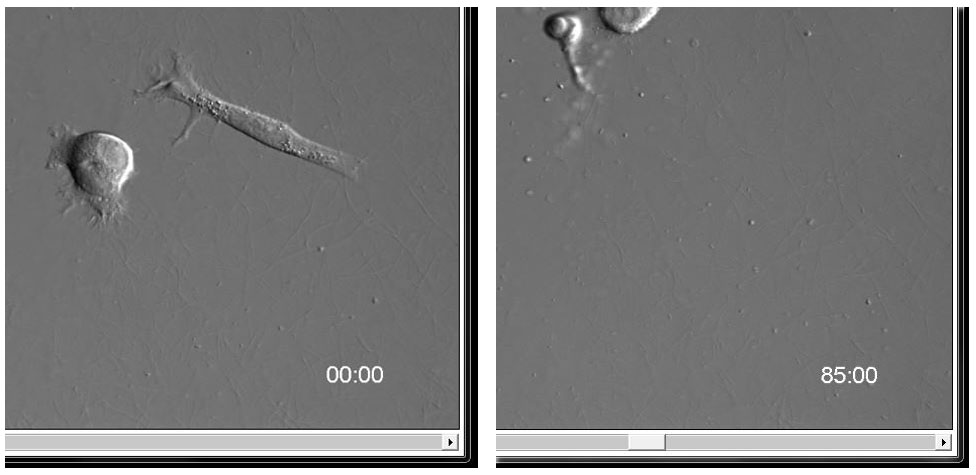
Before saving your movie you can embed a time stamp, whihc helps the viewer understand the time interval and total time of the movie as they are watching it. To add a time stamp, select your time series stack and go to Image -> Stack -> Time Stamper.
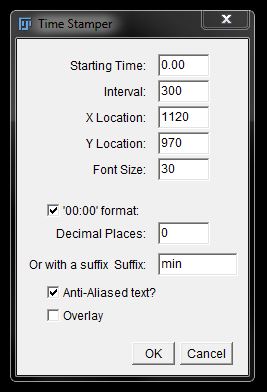
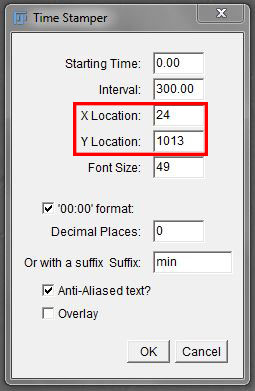
In the Time Stamper window you will need to enter the time frame between images und Interval and the format you want the time stamp to be in. You can also specify the X Location and Y Location of the time stamp in the image (given in pixels).
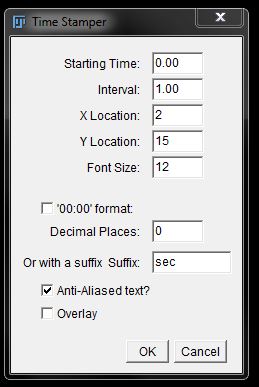
In this example, the time interval is 5mins (enter 5.00 for minutes or 300 for seconds). How you enter the interval will also determine the time stamp format. If using the time format - '00:00' with the invterval entered in minutes, you will see HR:MIN in the time stamp. If the invterval was entered in seconds, you will see MIN:SEC in the time stamp. If using a sufix, the interval and suffix must have matching formats (ie: don't enter 300 as your interval and then use mins for the suffix).
Pixels for an approximate location can be found by hovering the mouse over the area of the image you wish to use. Pixel co-ordinates will be displayed in the information bar. Enter the pixel co-ordinates you want for placement in the X Location and Y Location boxes.
Note: The pixel co-ordinates become the starting point for your time stamp, not the centre point.
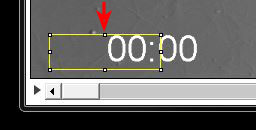
Select OK to insert the time stamp into the stack. The timer will automatically run as you scroll through the stack.
You can now save your time series as a movie, using the same method as above, and the time stamp will remain embedded.
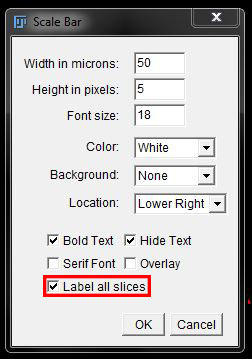
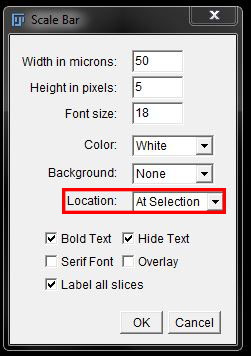
To add a scale bar to your movies, follow the same method as taught in the FIJI Basics workshop for single images. Go to Analyze -> Tools -> Scale Bar and set desired parameters. For movies you must ensure you check the box next Label all slices before clicking OK to insert the scale bar. This will ensure all frames of the movie contain the scale, not just the first frame.
You can also use ROIs for placement of the time stamp and scale bar in movies to ensure accurate positioning in your desired location.
For time stamps, use a rectangular ROI and outline the area you want to place the time stamp in.
Follow the instructions to instert a time stamp as described above, only now the X Location and Y Location boxes will be automatically filled with co-ordinates from the ROI. Do not change these. Enter your other values as required and click OK to instert the time stamp.
Note: The middle of the ROI box is the start of the time stamp position.
Once you have insterted your time stamp, click anywhere on the image to remove the ROI. Save your movie file as normal.
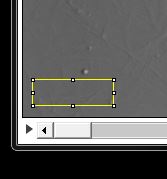
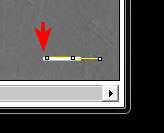
For scale bar placement, use the line ROI tool and draw a line in the area you want to place the scale bar.
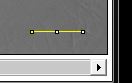
Follow the steps to insert a scale bar as normal. This time in the options, the length of the ROI will be detected and used as the scale bar length - you can change this back to your desire length. To use the ROI co-ordinates for placement, chose 'At Selection' from the drop down menu under Location. Again, ensure Label all slices is checked before clicking OK to insert the scale bar.
Note: For scale bars, the start of the ROI line is also the start of the scale bar.
Hyperstacks
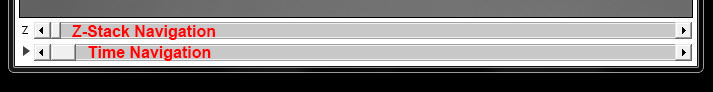
Often images will be captured with a 4th or 5th dimension; that is they will have a combination of multiple channels, z-sections and time. For these images the data will be presented as a hyperstack.
The dimensions are presented within a single window, with each dimesnion respresented individually and haivng its own slider. You can scroll through each dimension independently using these sliders.
Hyperstacks have their own specific tools found under Image -> Hyperstack. Most of these tools can be used to reduce the dimensionality in a specific way.
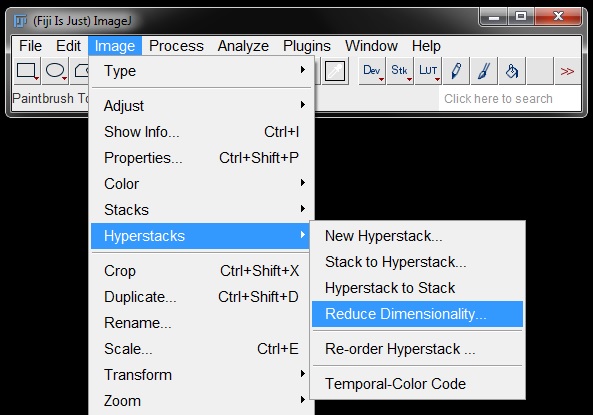
Hyperstack to Stack will combine all dimensions into a single stack with c_z_t frames (ie; here 1 colour * 61 z- planes * 25 time points = 1525 frames).
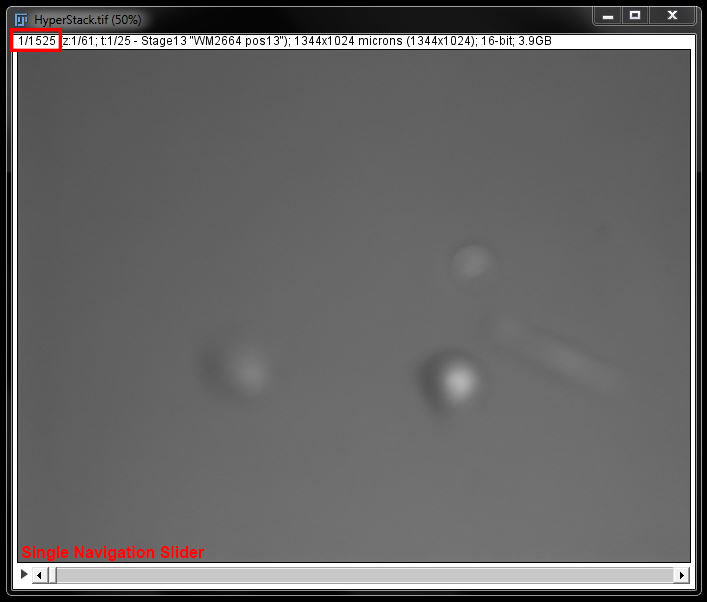
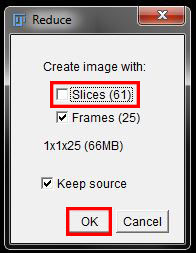
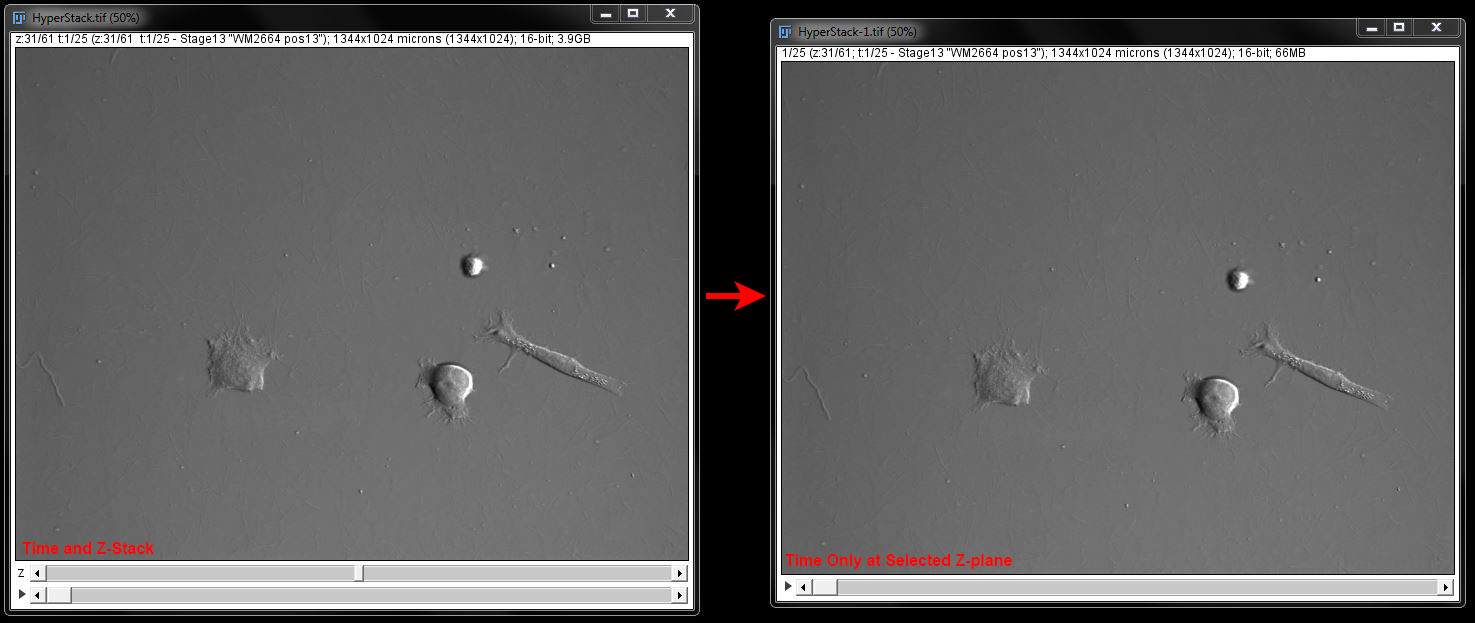
Reduce Dimensionality will allow you to pick one dimension to remove or keep in the hyperstack.
For example you can select time only by un-checking the box beside 61 slices, and a single stack of all time points at the current z-plane will be generated.
In a hyperstack some of the tools demonstrated in FIJI Basics for single dimension stacks can also be applied. And all can be used on a hyperstack following reduction in dimensions as shown here.