PART 6: SIMPLE IMAGE MEASUREMENTS
Many of the simple FIJI functions that you have previously learnt about can be combined with other tools for more complex processes to analyse and measure your data. Here, our instructions become more speicified as wel go through several examples of common measurements using the different tools in FIJI.
In this section we use the images RGB-blue.tif, RGB-green.tif, NeuralTubeRed.tif and Nuclei-1.tif for demonstration.
Area Measurements
To perform any measurements on our image we must ensure the scale is calibrated. Checking and setting the scale calibration was covered in FIJI Basics.
We also need to select an area within the image that we want to measure. Without a selection, the program would give an area measurement for the entire image, rather than just the area of interest. In this example we will use a threshold, but you can also select a specific area to measure by using an ROI.
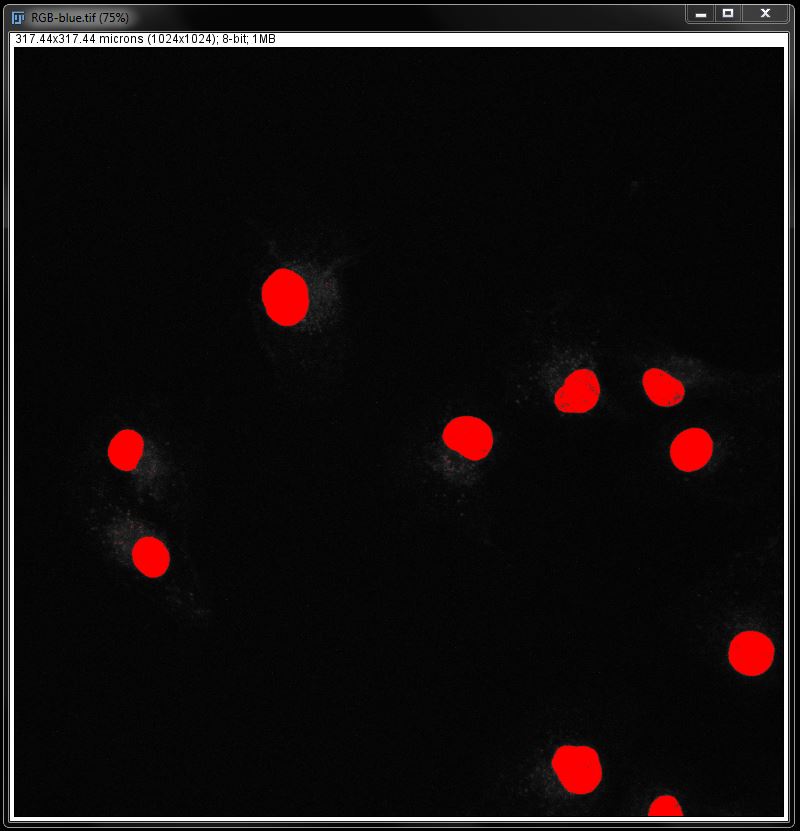
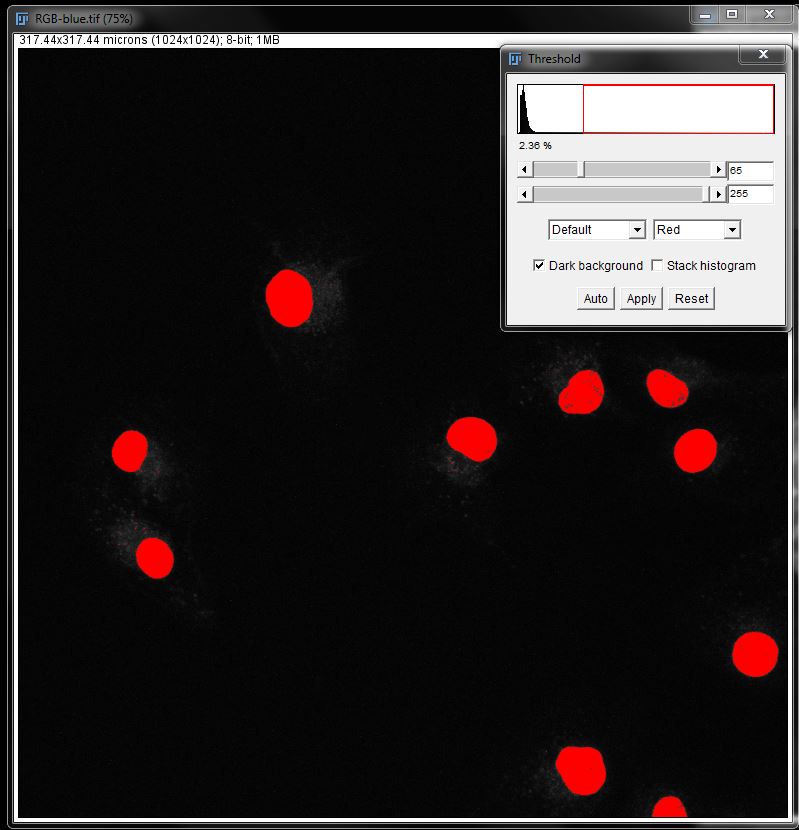
Open the image RGB-blue.tif. Check that the scale is calibrated before carrying out any further steps.
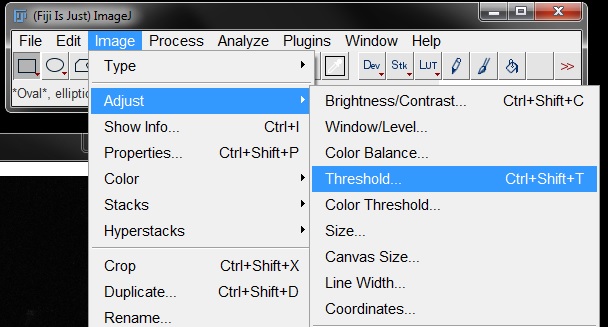
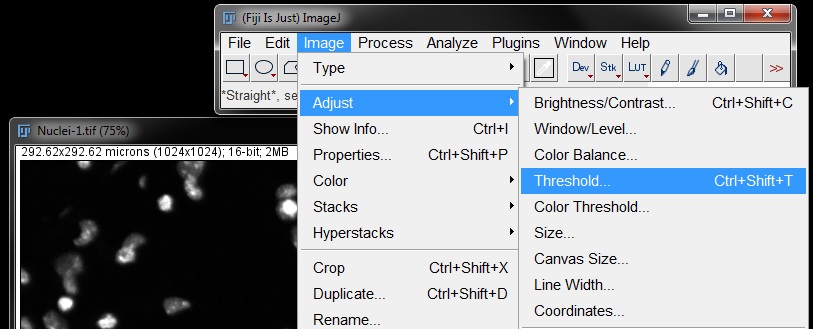
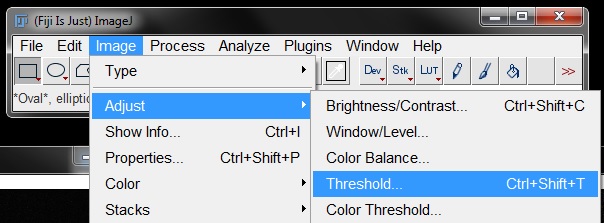
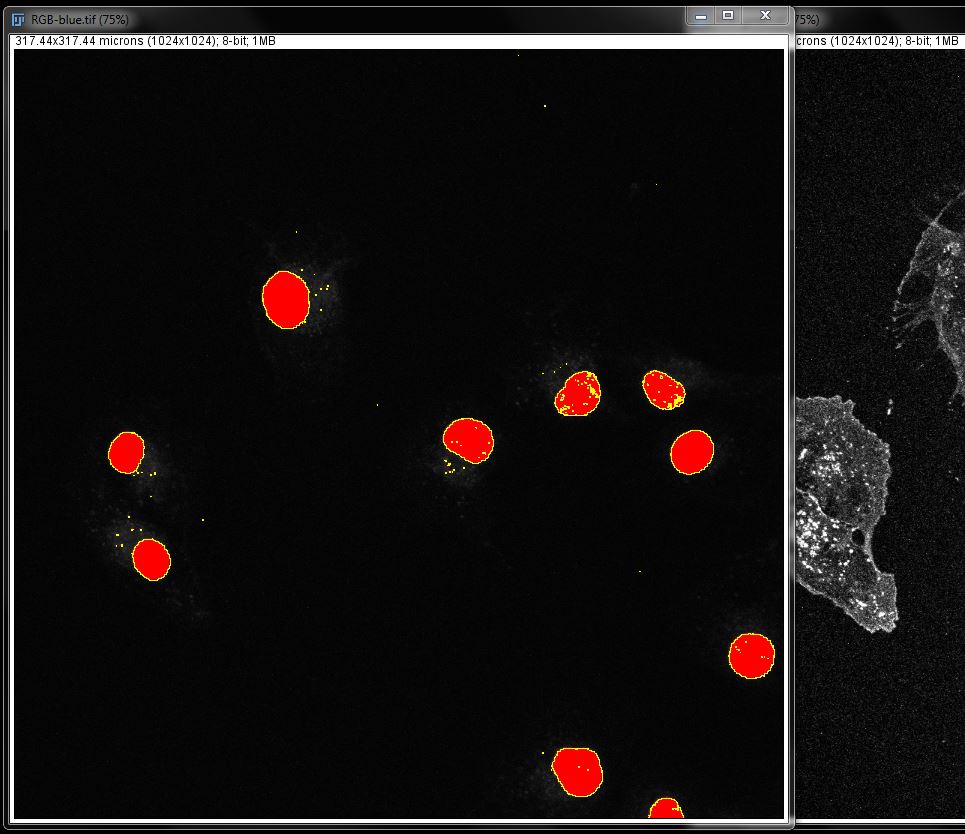
For colour images I like to apply a grey LUT to allow better contrast between the stain and background during thresholding. You may also like to Duplicate the original image and work on a copy. This image is already grey, but apply a grey LUT if you are working with a colour image and duplicate the image if you would like. Then go to Image -> Adjust -> Threshold (or use short cut Ctl + Shift + T).
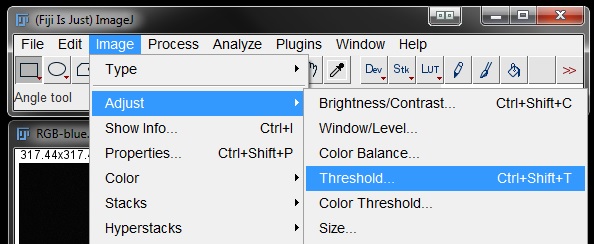
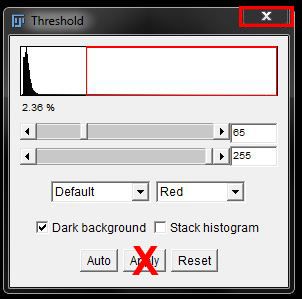
Fit your threshold to the data as best as possible. Here I have used the Default algorithm set at 65 and 255. For your own data you will need to find a threshold that works for you.
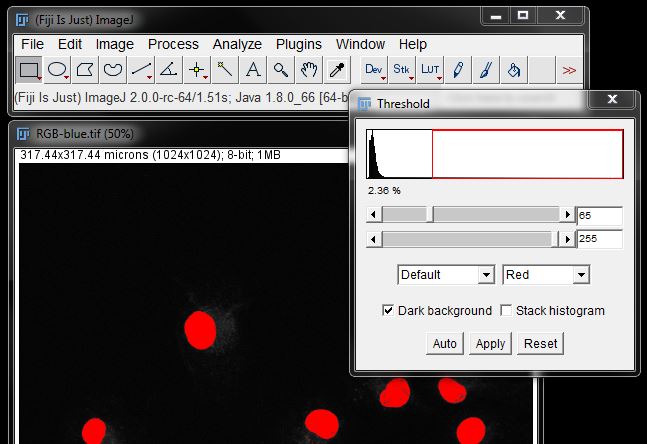
Close the options box to keep the selection as a threshold, or click Apply to generate mask as previously described.
If you choose to work with the threshold you can skip straight to measurements from here, however the threshold is not always a perfect selection of the data. Which is why we often create a mask instead.
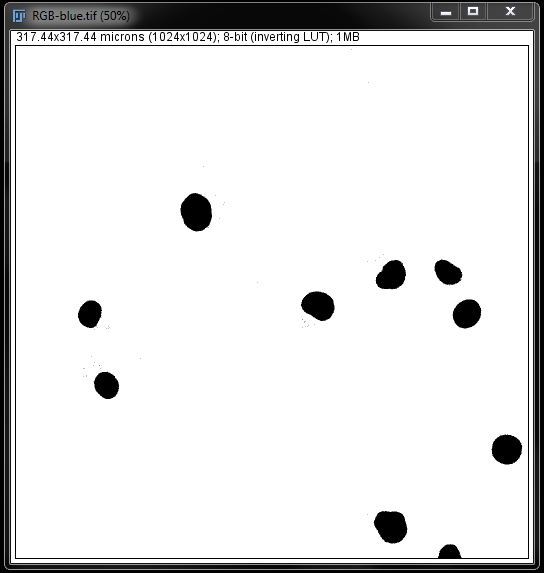
If you are working with a mask you can perfect your selection using filters. In this image mask there are a few blemishes that may affect the measurement. You can see below that we have some small speckled areas detected outside the nuclei, as well as some spots within the nuclei that are not masked completely.
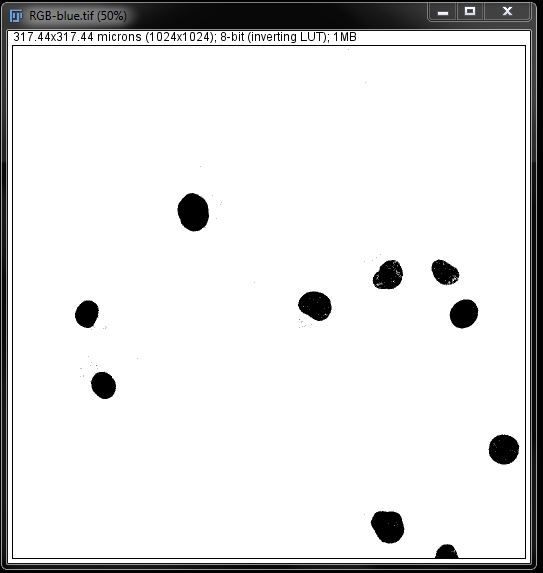
To take care of these 'gaps' in the nuclei mask we are going to use the Fill Holes option found under Process -> Binary -> Fill Holes.
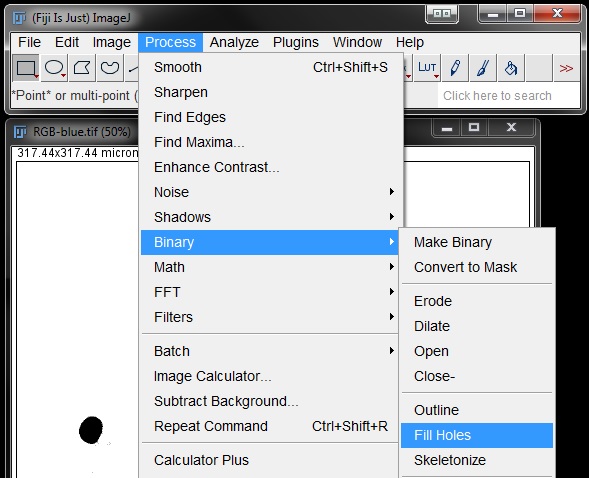
This will complete the mask over areas that contained gaps previously.
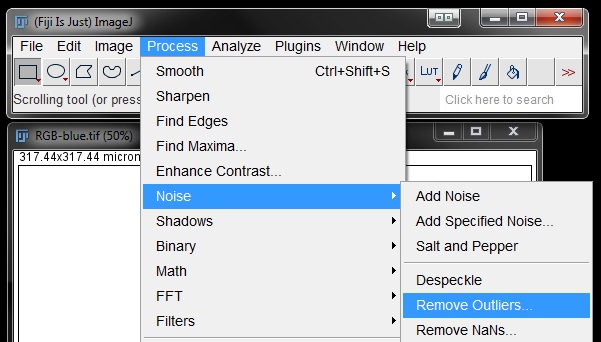
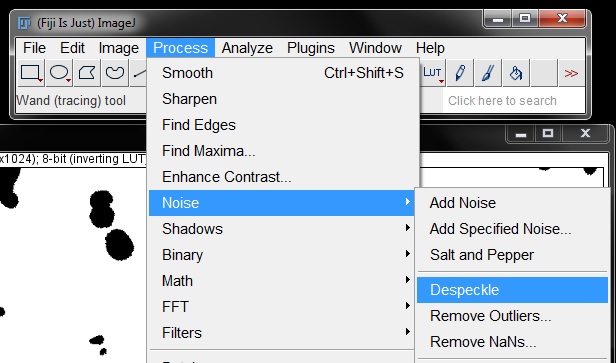
Next we will remove the small spots detected outside the nucleus using the Remove Outliers filter. Go to Process -> Noise -> Remove Outliers.
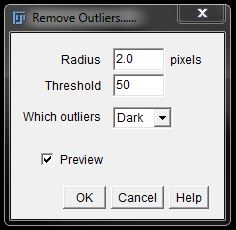
Turn on the preview, ensure it is set to act on the Bright or Dark part of the mask underthe Which outliers drop down menu (this will be dependant on your mask colours - for me it needs to be set to Dark). Set a pixel radius that captures all spots outside the nuclei, in my example the default setting of 2 works nicely. Find an option that works for your image. Click OK to apply the filter.
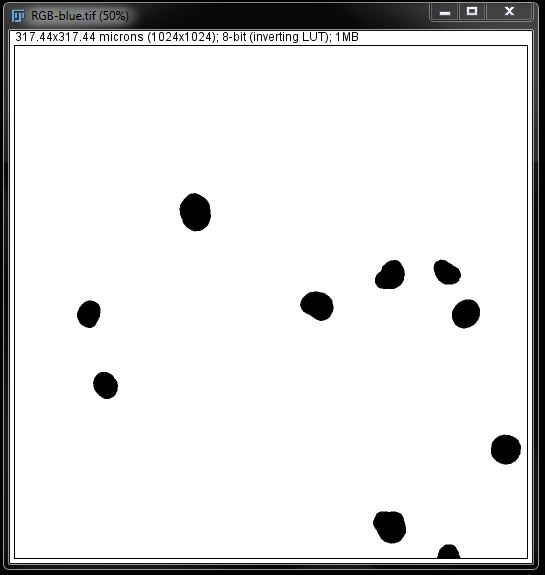
You should now have a mask that nicely represents the nuclei in the original image.
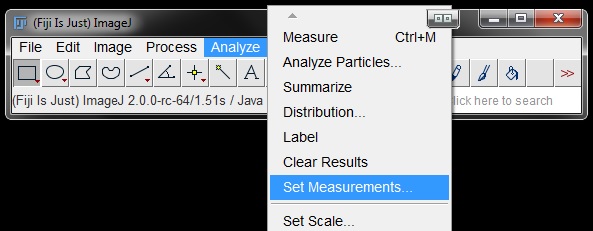
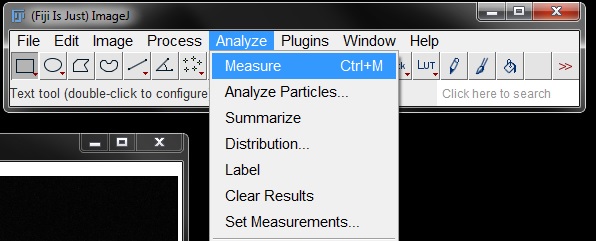
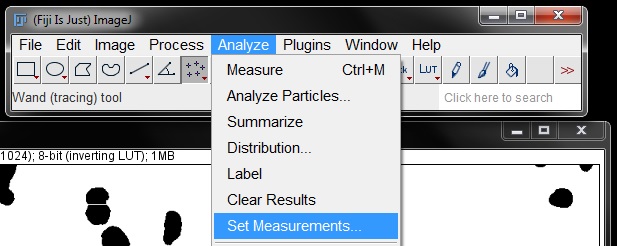
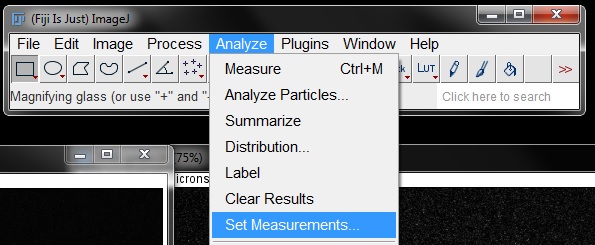
To measure the area in either your thresholded image or your mask, you first need to set your output parameters. Go to Analyse -> Set Measurements.
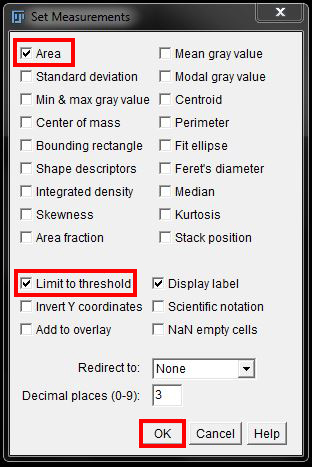
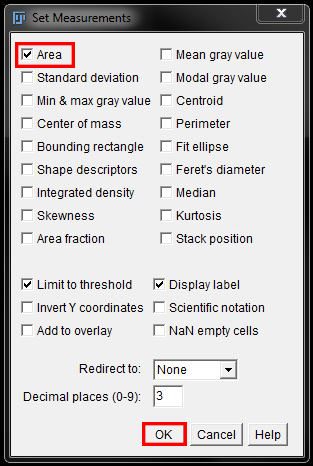
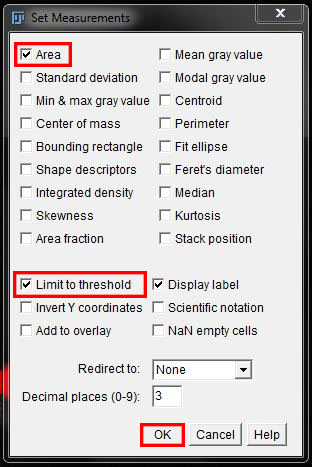
In the Set Measurements window you can choose what you want to measure by clicking on or off the checkboxes beside different parameters. Here we will turn on Area only.
Ensure you also have Limit to threshold selected in the options so that FIJI does not measure the entire image.
Click OK to save the output parameters.
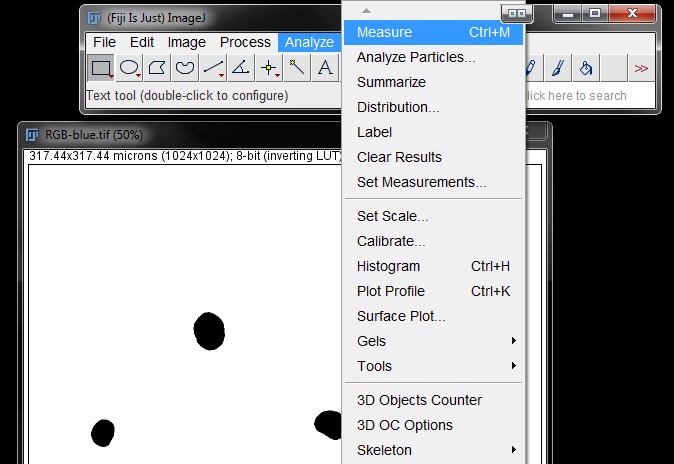
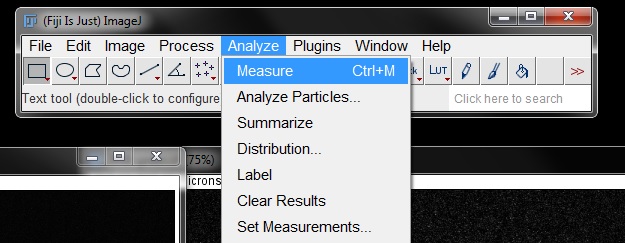
Now that the parameters are set, to measure the area of the nuclei using the parameters you have just set go to Analyze -> Measure (or shortcut Ctrl+M).
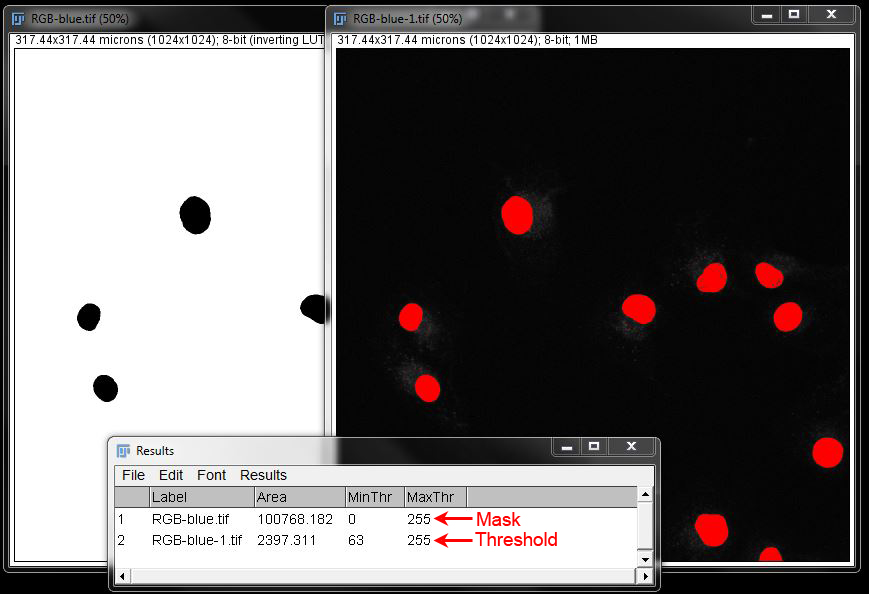
This will give you a results table with the area of the nuclei. You will notice there is only one measurement. This is because this method measures the mask or threshold as a single entity.
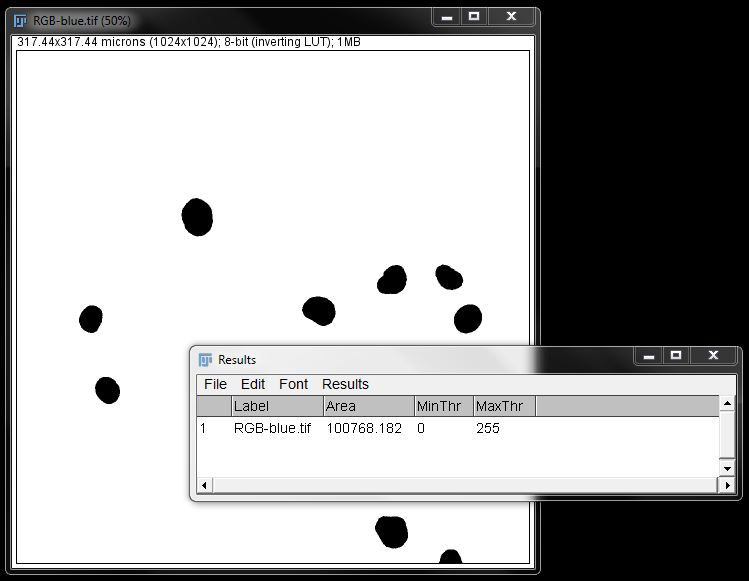
If you have used a mask for your measurement, you may notice a rather large number. Compare here the measruements from a Mask and a threshold on the same image.
Sometimes FIJI will measure a mask as expected perfectly fine. But often It will still measure the entire image, disregarding the selected/masked area. You can fix this with a simple additional step.
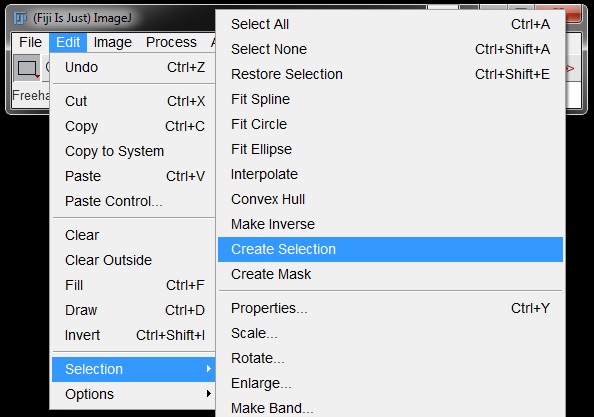
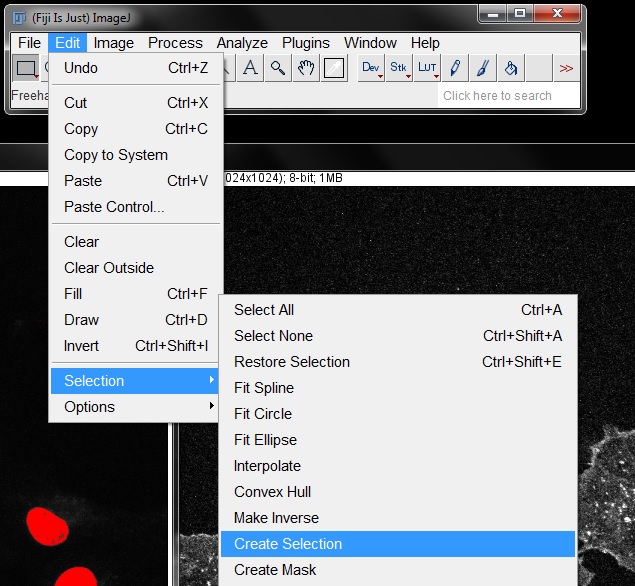
Go to Edit -> Selection -> Create selection. (Masked area must be black on a white background here as the ROI selection will be for the black component of the image)
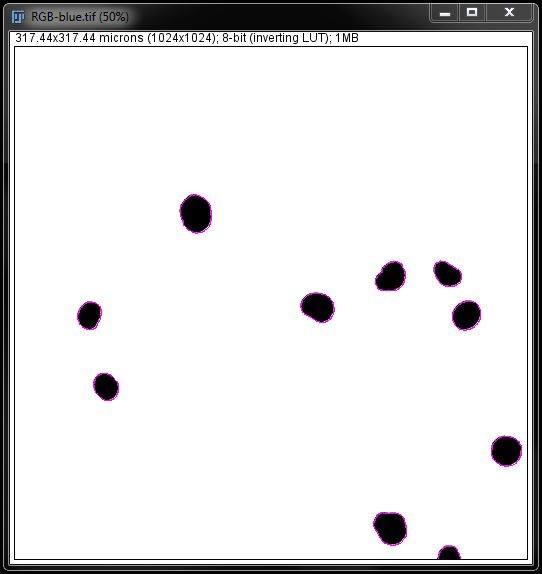
ROIs will apprear around all of the masked nuclei.
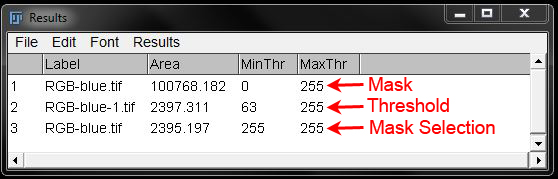
Repeat the measurement (Analyze -> Measure). You should have the correct value now. Compare this result to the previous 2 values.
Mean Intensity Measurements
To generate a basic intensity measurement we apply a similar method as the basic area measurement. However, for intesntiy measurements, even with the output parameters set to Limit to threshold, or using ROIs, if we try to measure a mask we will only get intensity readings on the values within the mask itself (0 and 255 as it is a black and white image). Therefore, when measuring intensity the threshold MUST be maintained, never converted to a mask or binary.
To measure intensity, open the image RGB_Blue.tif and repeat your thresholding. Go to Image -> Adjust Threshold.
Find the threshold to best fit the data (I have again used Default at 65 and 255). But DO NOT press apply! Close the threshold options box using the cross at the top right.
This will give you an image with the stain selected by threshold, but not converted to a mask.
With a threshold we can no longer make modifications in order to perfect our selection. What we see here is what we will measure.
So we can now go straight to setting our measurement paramenters. Again go to Analyse -> Set Measurements.
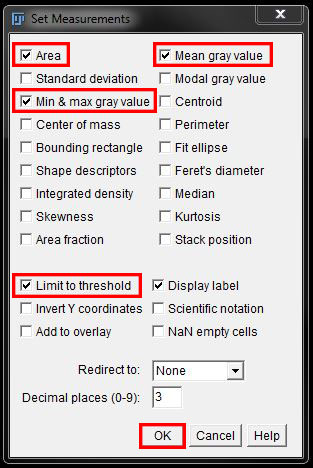
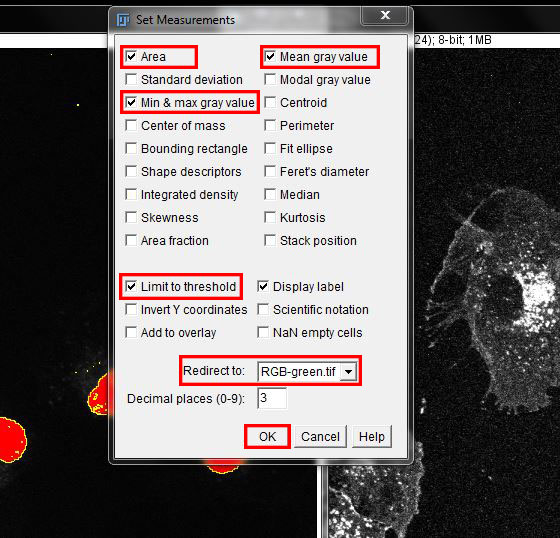
This time we want to set Area, Min & max gray value and Mean gray value.
Again ensure the checkbox next to Limit to threshold is selected.
Select OK to save the changes.
Repeat the measurement process as before by going to to Analyze -> Measure (or shortcut Ctrl+M).
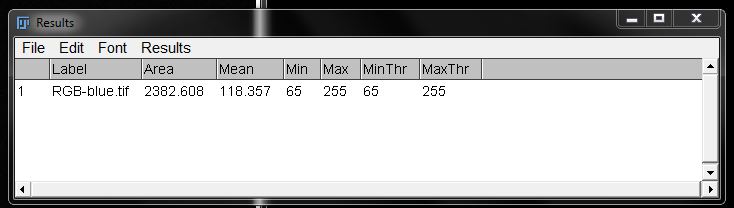
This will give you a measurement for the intensity in the original image, limited to the area under the threshold you have set.
Intensity Map (Rainbow RGB LUT)
For a visual representation of the intensity, you can map the intensities across the image very simply using a LUT.
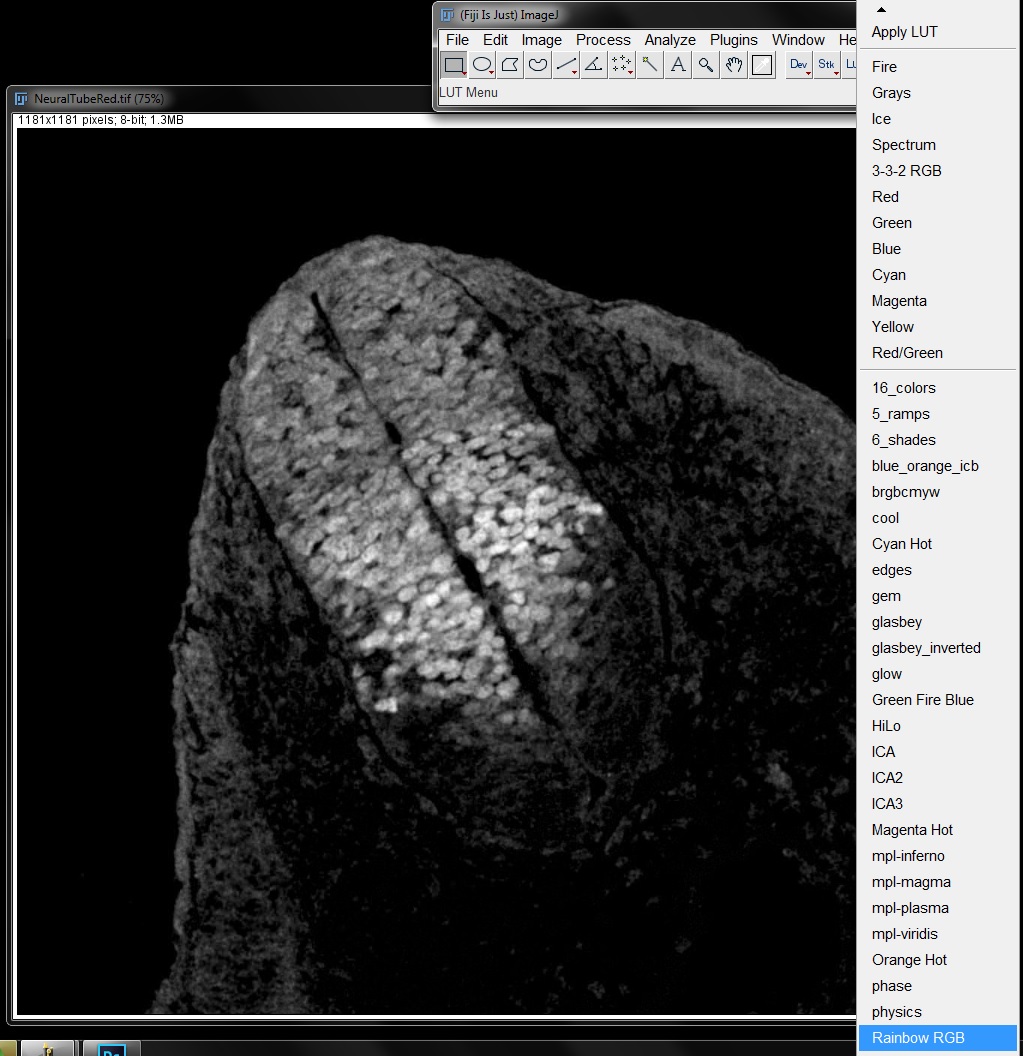
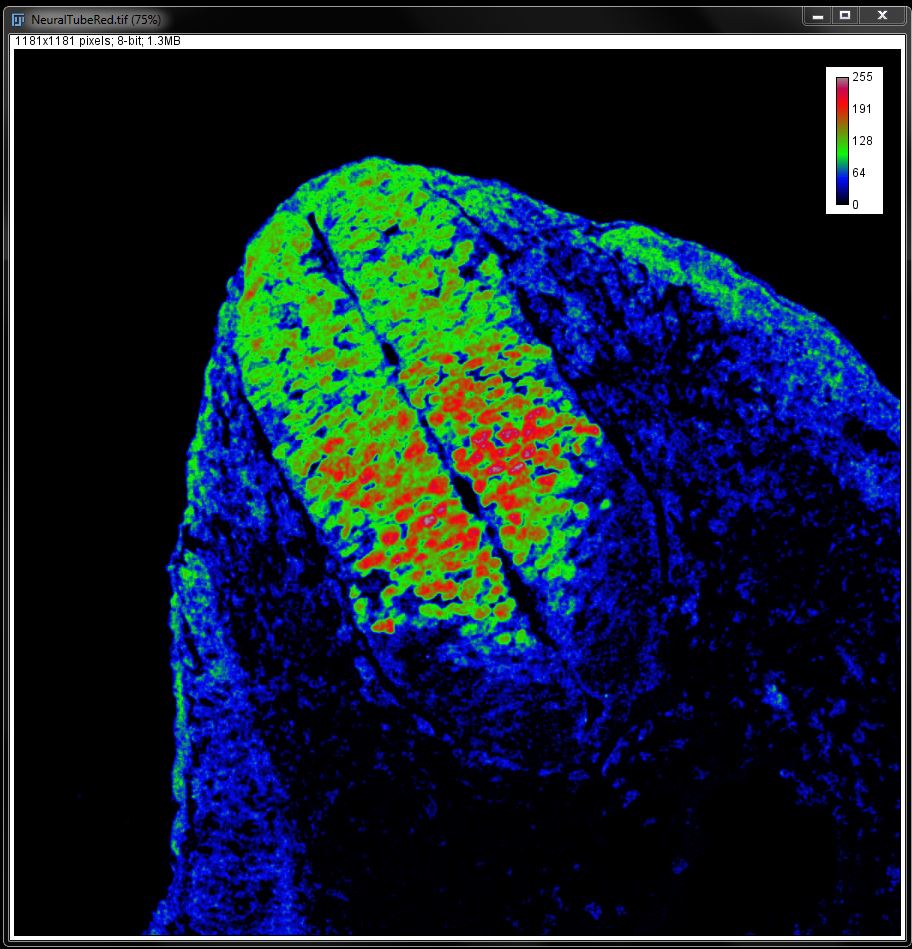
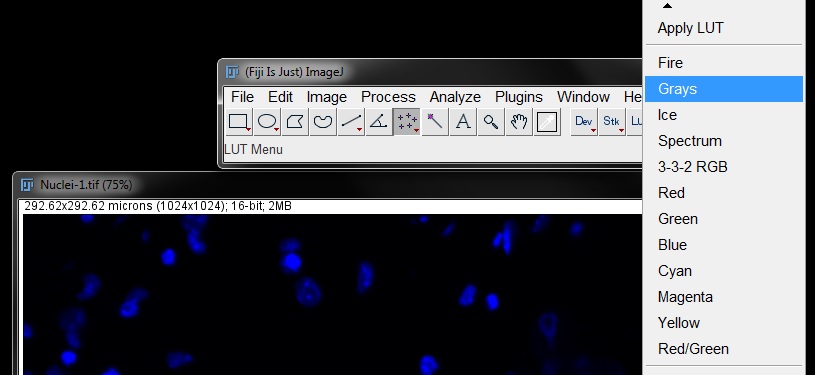
Open the image NeuralTubeRed.tif and go to Image -> Look up Tables and select the LUT Rainbow RGB from the bottom of the list (or select the Rainbow LUT from the LUT menu in the tool bar).
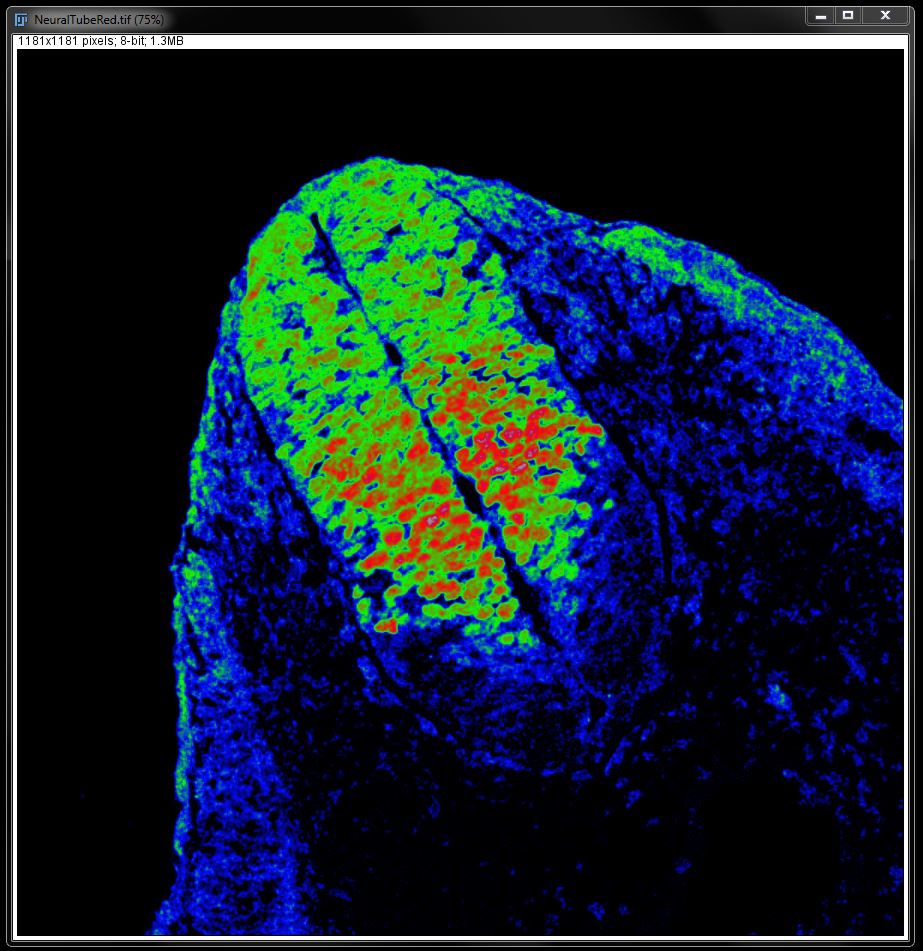
This will apply a multi-coloured LUT to your image, in shades of red, blue or green. The highest 33% of intensities are reds, the middle 33% are greens and the bottom 33% are blues. This gives the viewer the ability to easily see the range of intensities present in the image.
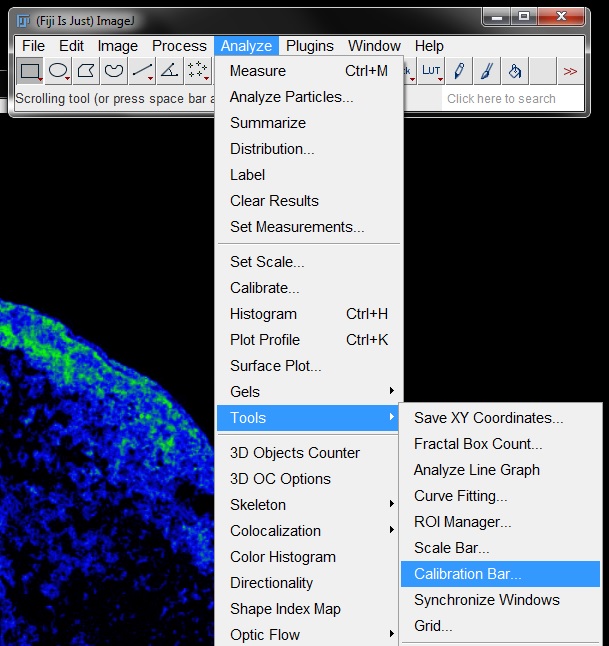
You can add a calibration bar for the intensities by going to Analyze -> Tools -> Calibration Bar.
In the Calibration Bar window you can specify the position and configuration of the calibration bar. The Overlay tick box allows you to create the bar as an overlay of the original image, instead of burning it into the image permanently.
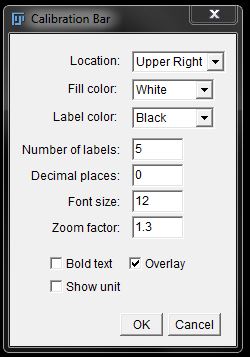
Click OK to add the calibration bar to your image.
Simple Counting
Often we want to know how many cells or object we have in an image. For a low number of objects you can easily count manually using the multi-point tool.
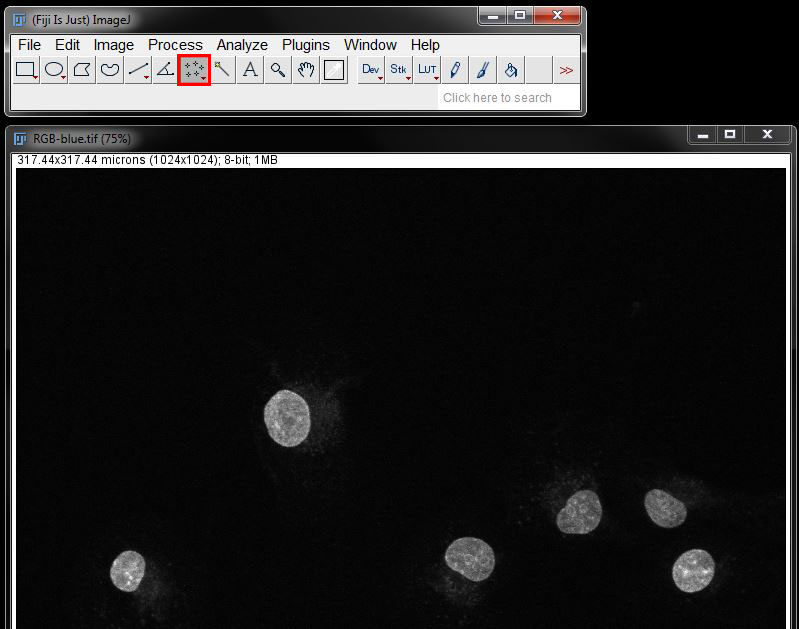
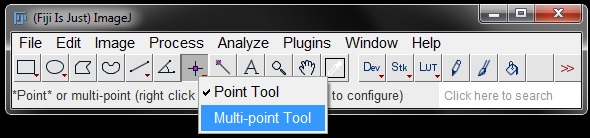
Open RGB-Blue.tif and select the multi-point tool from the FIJI tool bar (as demonstrated in FIJI Basics).
If multiple points are showing in the tool icon (as below), you can simply click it on.
If only a single point is visible on the icon, switch it to multi-point by right clikcing and selecting Multi-point Tool from the options.
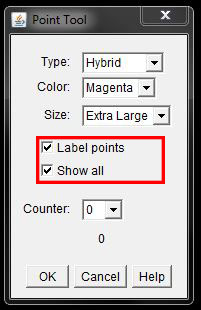
Once the tool is active (indented), double click on the icon again to open the Point Tool options window. Set up your points as you want them to appear on your image by selecting colour and size from the drop down menus. Ensure Label Points and Show All are selected. Leave the window open.
Return to your image and click once on every object you want to count. A point will appear on the image for each click. As you click you will see a counter increasing at the bottom of the Points Tool window. Once you have clicked on all of your objects, the final number will be your object count. Each object will also be marked in the image as a check of whether you correctly counted the objects.
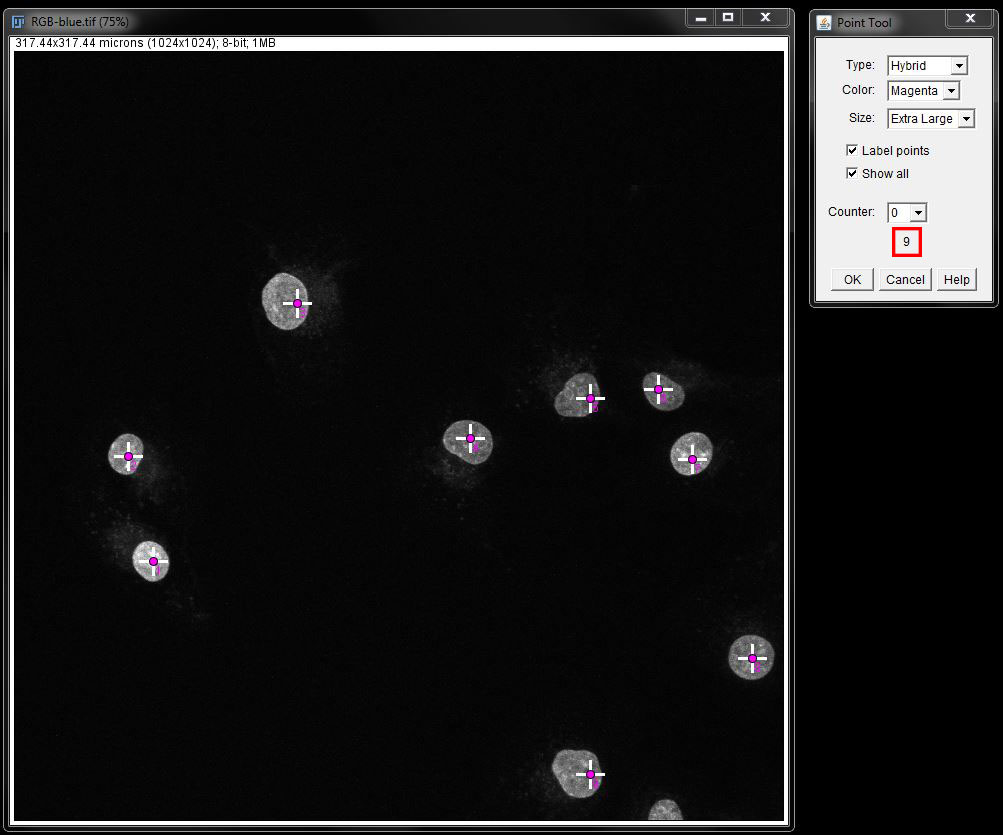
The window shows that we have 9 nuclei in this image.
Note: We always exclude partial nuclei/cells/objects at the edges of an image from analysis such as counts.
Analyse Particles
For an image with a large number of objects manually clicking to count can be a laborious task. For these images you can use the Analyze Particles tool. This tool also enables you to measure other aspects of the objects (such as area) at the same time as counting.
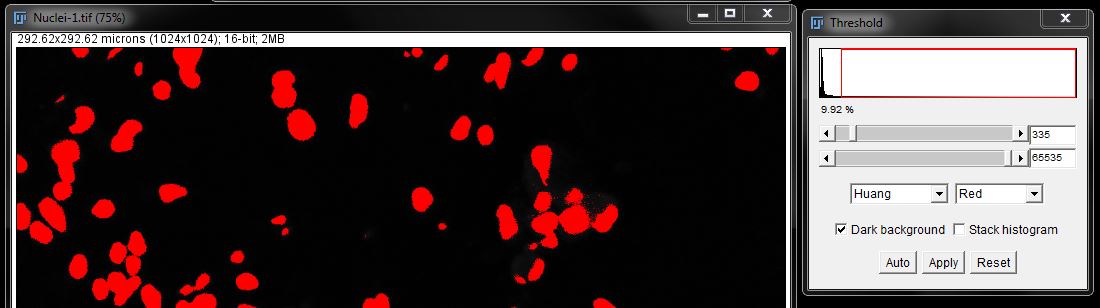
To use this tool, you first need to threshold your image as previously shown. Open the image Nuclei-1.tif. Apply a grey LUT if you desire. I find this makes thresholding easier.
Select a threshold that fits your data then click Apply to create a mask (here, I used the Huang algorithm).
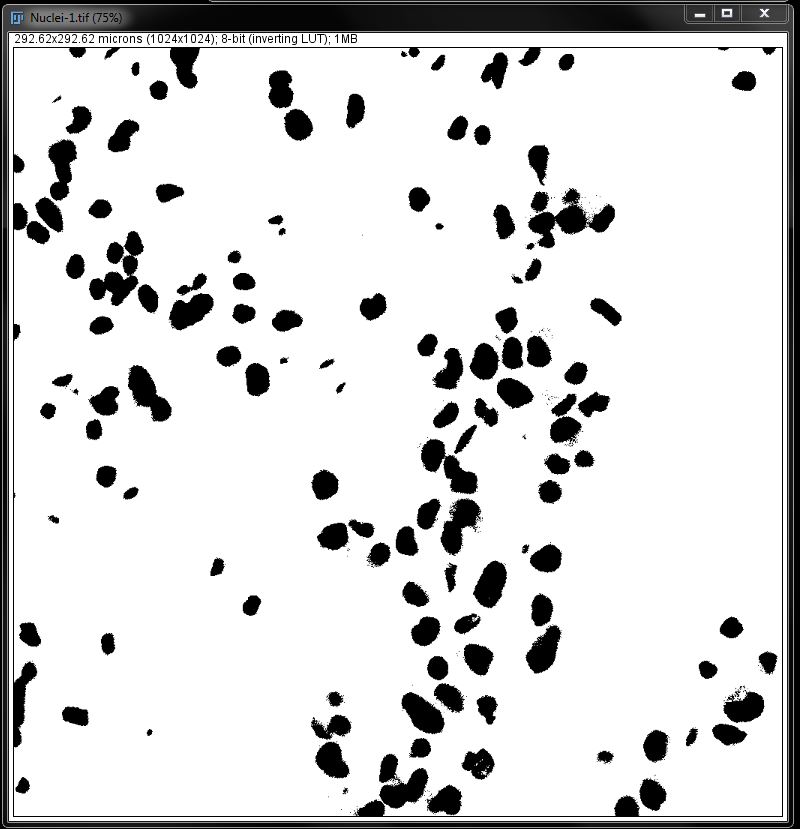
You will see several issues with this mask; gaps within the nuclei and small particles detected outside the nuclei.
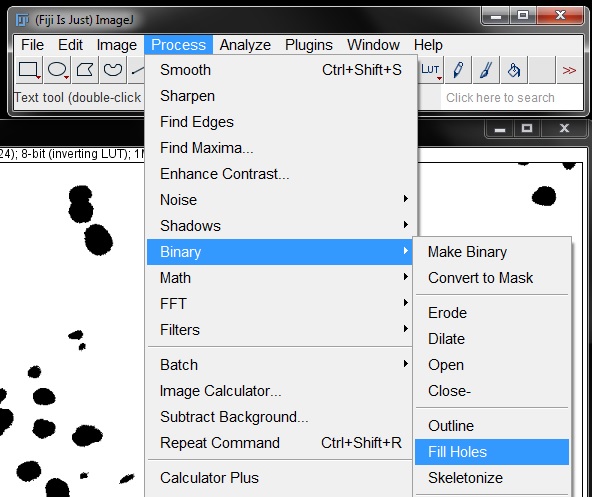
For counting these small particles can be problematic as they will be counted as an object, when they are in fact a false positive. To clean up the mask a little, we will apply the Fill Holes and Despeckle tools to the mask. Find these under the Process menu.
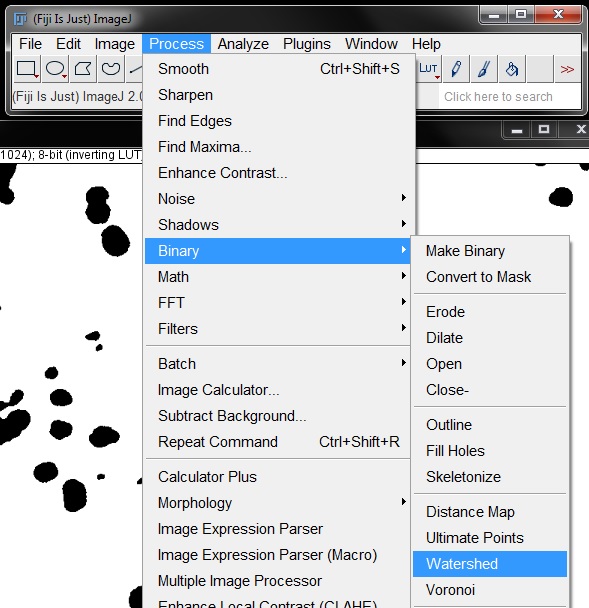
Another problem that will result in a false count with this mask is several areas where nuclei were touching, resulting in them being masked as a single object. To separate these we need to apply a Watershed binary filter to the mask. Select this from the Process -> Binary menu as previously described to separate touching objects.
This gives us a fairly neat mask for analysis. There are still a number of small objects that will be counted as false positives but we can exclude them during the analysis process.

Before we do our analysis, check the measurements you need are set by going to Analyze -> Set Measurements. Here we will only check Area.
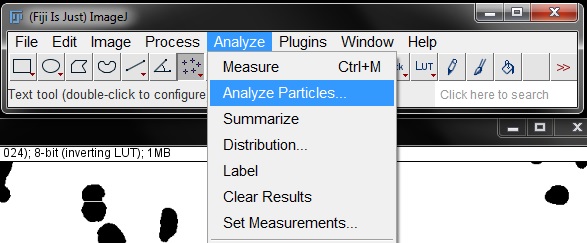
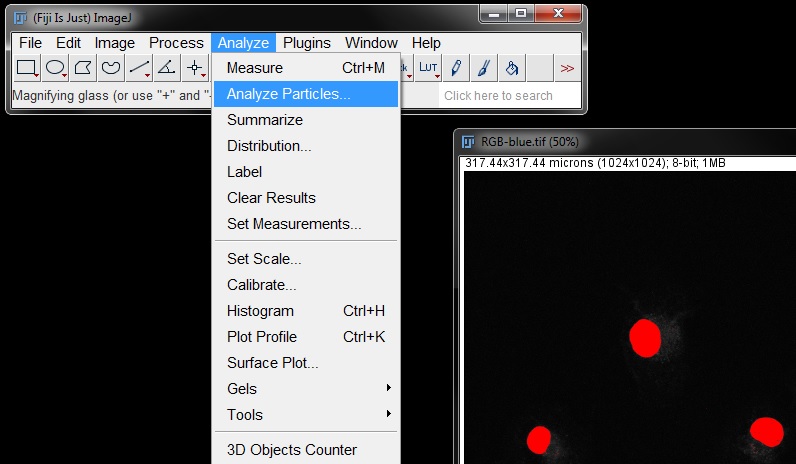
We can now count our objects using Analyze Particles tool. Find this under the Analyze menu.
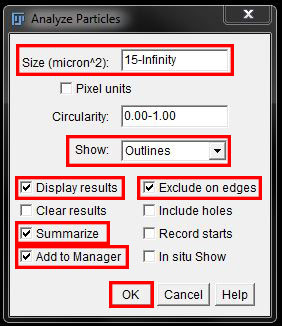
In the options window, we can adjust the size to exclude smaller objects. This eliminates those false positive specks that remained in the mask. I have set the lower limit to 15 for this example. Leave the upper limit unchanged (infinity). Leave Circularity at the default values. Set Show: to 'Outlines' and tick the boxes to Display Results, Summarize, Add to Manager and Exclude on Edges as shown below. Press OK to measure the objects.
This set up will result in a number of new "results" windows. you will now have a results table displaying the selected measurements for each individual object detected (in this example, Area only). The Summary box will display the total count for you. An image of the outlines, numbered to match the results will be created, which you can save for future reference. We also have all objects added to the ROI manager which can be overlayed other images for measurements (ie intesity in another channel), or saved for future use.
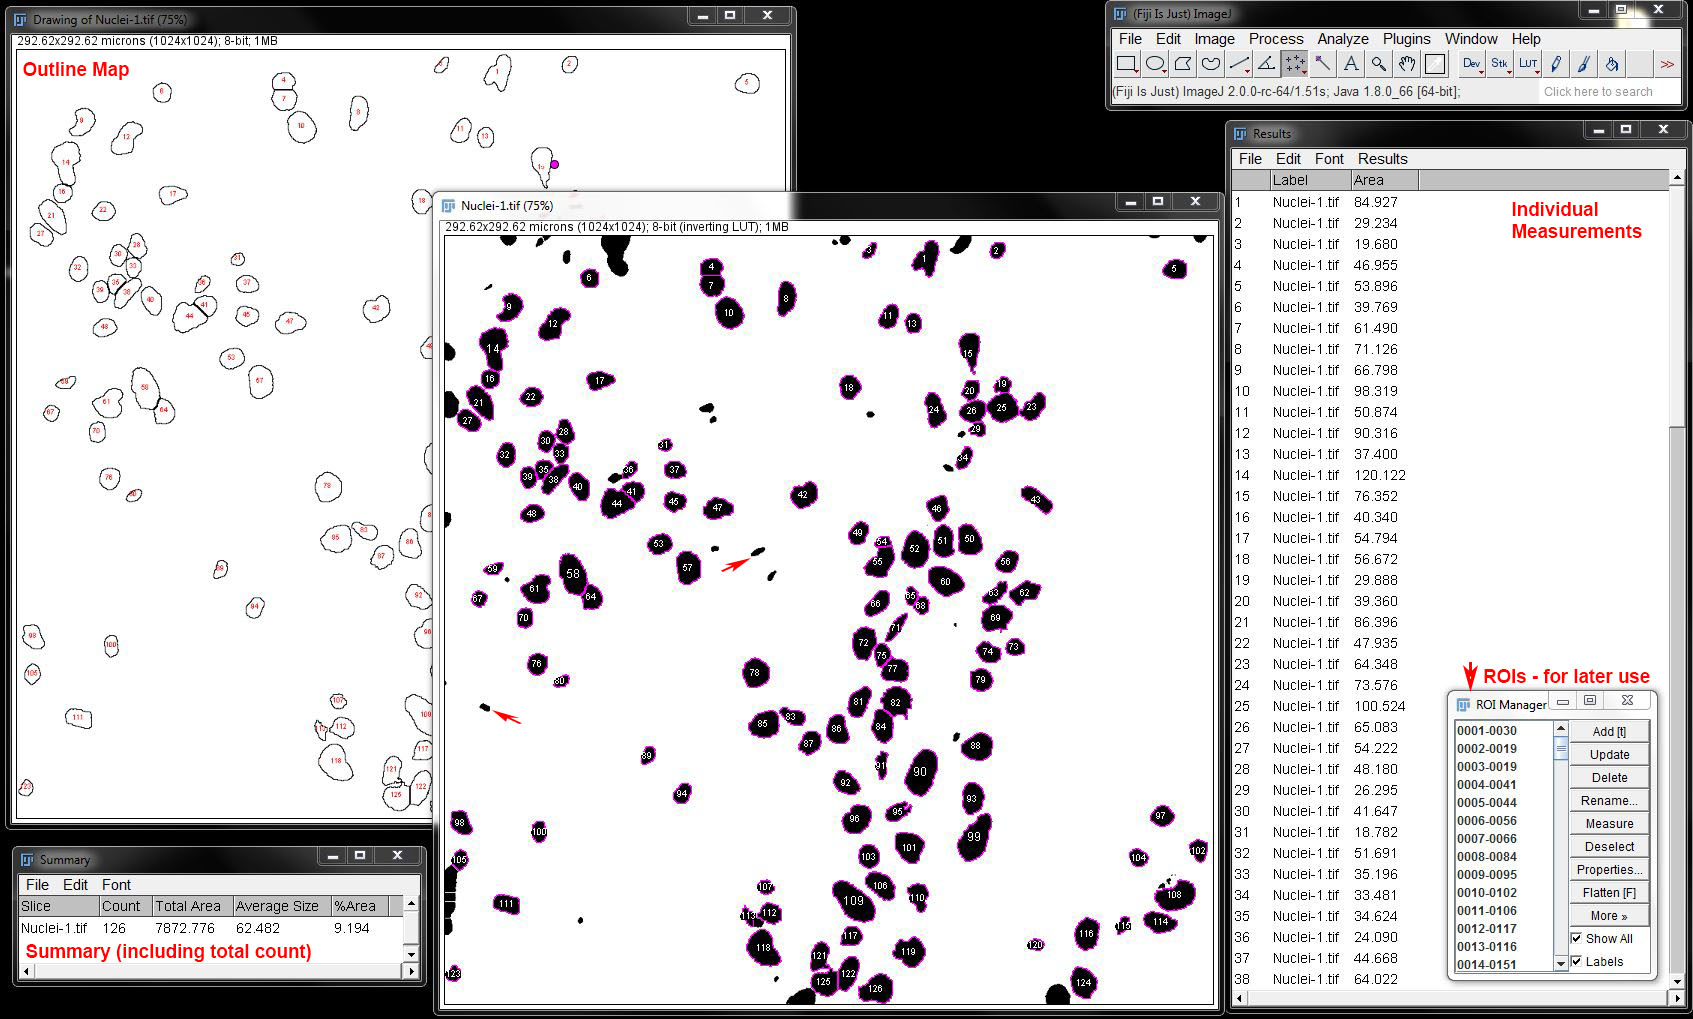
You can also see in the original image that the small outliers that we didn't want to count have been excluded from the analysis (no ROI outline) by adjusting the size. We would use the Outline map and the original image here to ensure we have measured only the objects we want, and adjust our optins and re-measure if needed.
Redirect Measurements
Masks, thresholds or ROIs generated on one image can also be used to make measurements on another image. This allows you to measure the same area in different channels or images.
One method for applying your selection to a different image during measurement is to use 'redirect'.
To demonstrate this we will use the images RGB-blue.tif and RGB-green.tif. We will generate a threshold of the nuclei (blue) image and use that to measure the intensity of the stain in the "nucleus" only on the green image. We will also measure the area under the threshold in both the original image and the green image to confrim it is measuring the same area in both.
Open both images and generate a threshold for your nuclei using the methods previously described. In this instance leave it as a threshold only, don't generate a mask.
Ensure the thresholded nuclei image is active (click on the imge) then go to Analyze -> Set Measurements.
In the Set Measurements window, select Area as the measurement criteria. Make sure you have Limit to Threshold ticked, then click on OK to set the paramenters.
Once your parameters are set, go to Analyze -> Measure to generate the measurement.
We now have the area of the "threshold" as a control for ensuring we are measuring the same part on the green image.
To make sure this is the case, we want to generate a selection fo the thresholded area. To do this, go to Edit -> Selection -> Create Selection.
This will 'outline' the thresholded area as an ROI in the nuclei image.
We can now tell FIJI to measure any parameters we want in the green image, using this selection. To do this we open the Set Measurements settings again.
In Set Measurements, add Mean Grey Value to the measurement settings, then select RGB-Green.tif from the drop down menu under Redirect to:.
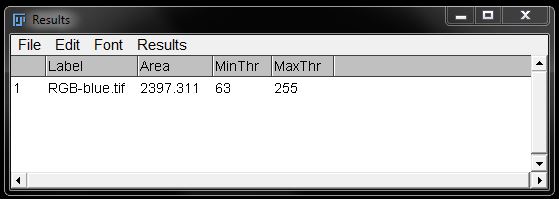
Click OK to perform the measurements on the second image. You will now get measurement for the second image in the areas under the original mask.
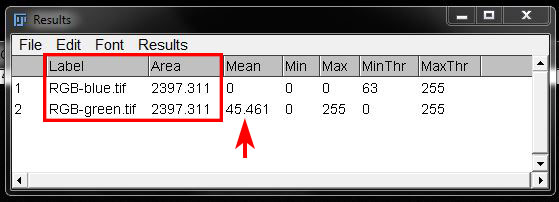
You can see from the comparisson with the blue image measurement that we have measured the exact same area in the green image. And we now have the mean intensity for the green image pixels (ie: your green stain) within that area.
Overlay ROIs
You can also overlay ROIs from the original image onto the second image using the ROI manager.
Open your two images (here we use RGB-Blue and RGB-Green again) and draw the required ROIs on image 1 (RGB-Blue), adding each to the ROI Manager as you go (as shown in FIJI Basics). Measure these in image 1 if needed.
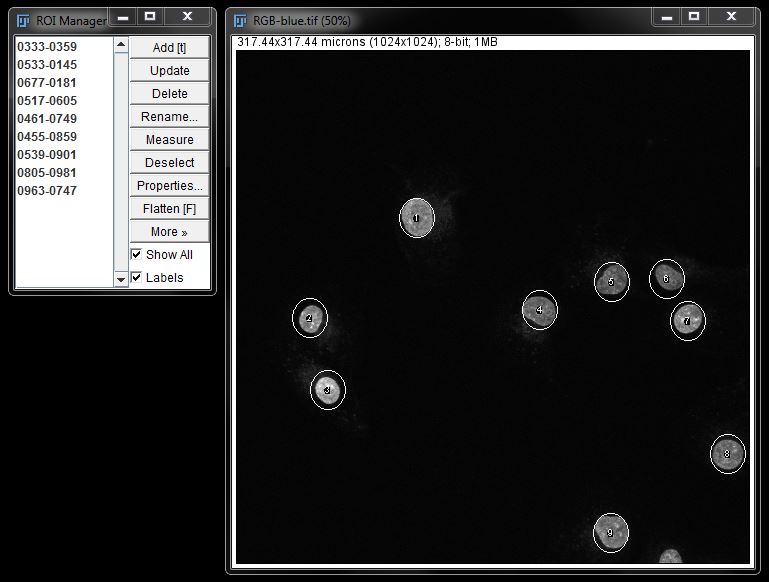
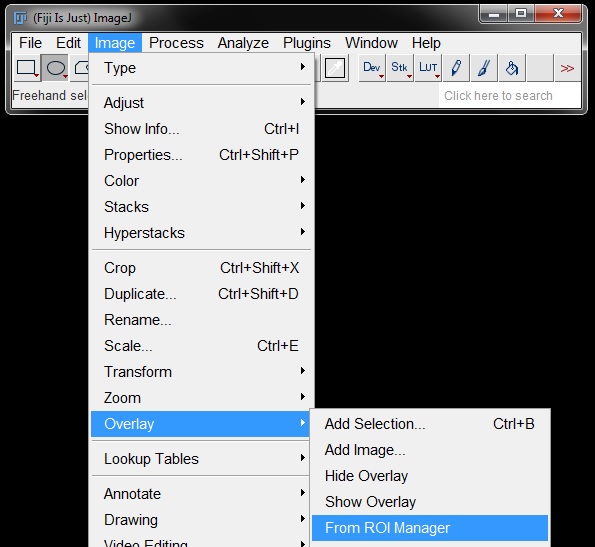
To apply the ROIs to another image, select your second image (RGB-Green) and go to Image -> Overlay -> From ROI Manager.
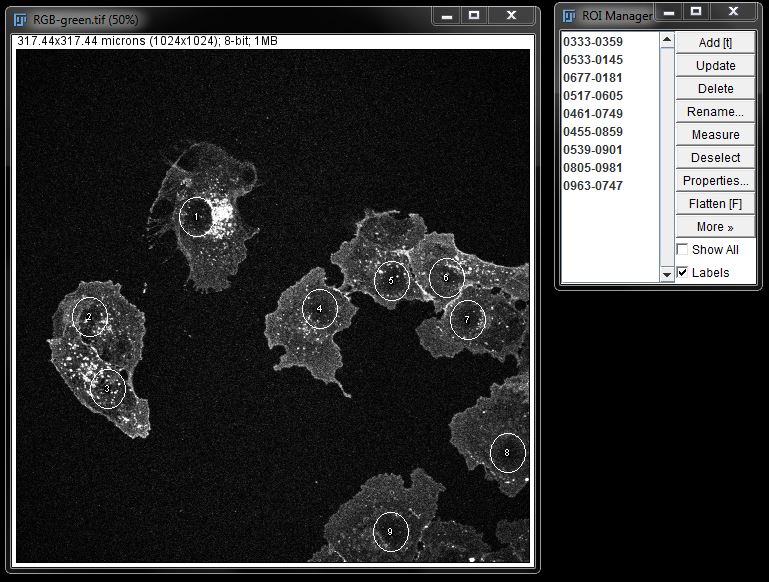
The ROIs generated from the mask will be applied to the second image and you can now set your measurements for the second image and measure the same area.
Note: you can also activate teh second image by clicking on it, then select an individual ROI from manager to display and measure it individually in the second image.
ROIs from Particles
You can also generate ROIS to overlay to a second image using the Analyze Particles tool.
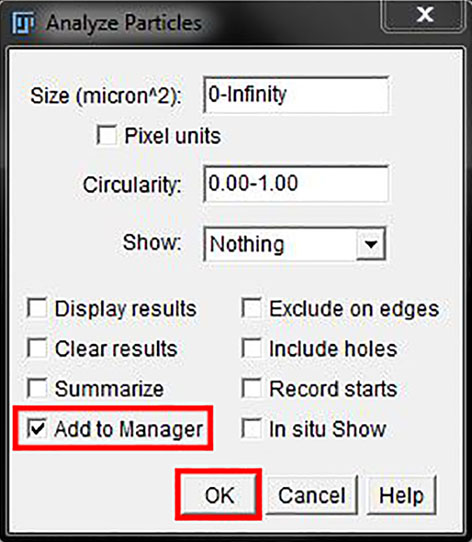
This time in the Analyze particles window, tick off every options box except Add to Manager. Select OK.
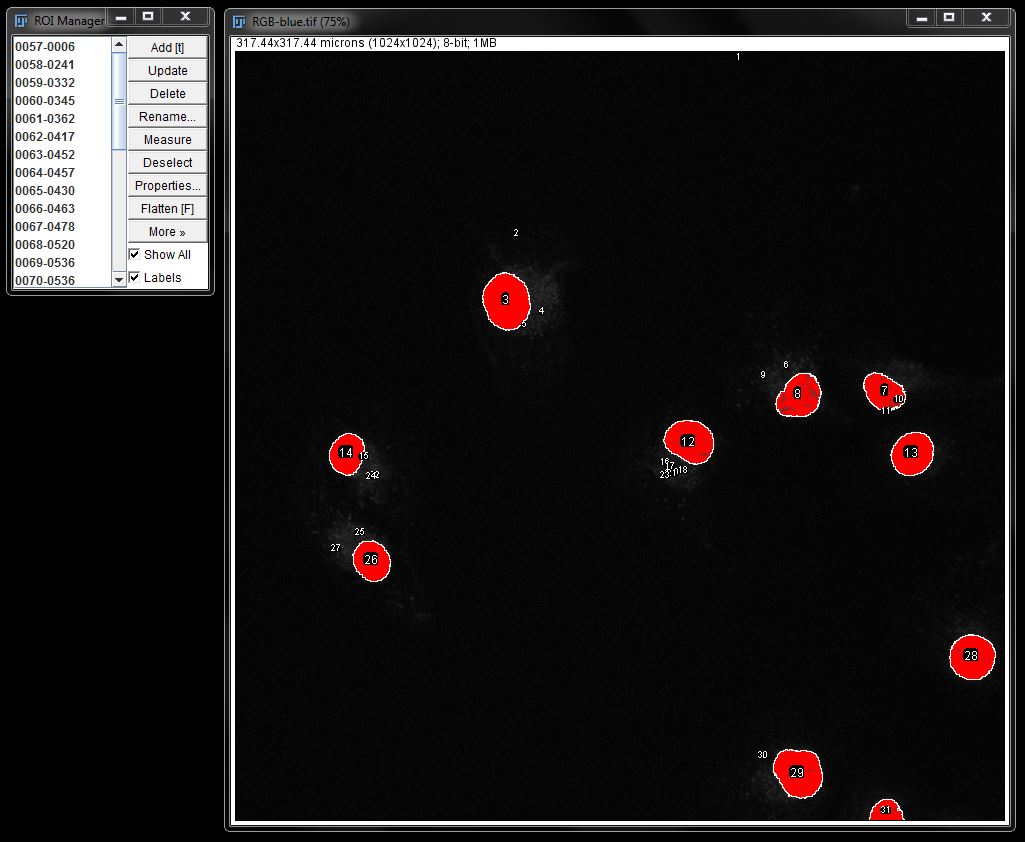
The mask or threshold will be converted to ROIs in the ROI manager.
When using a mask, you can use filters to remove any unwanted particles before creating ROIs. When maintaining a threshold, you can clean up any unwanted ROIs by changing the particle size in Analyze Particles options as shown before or selecting them in the ROI manager and deleting.
You can now make individual measurements using the ROI manager as normal.
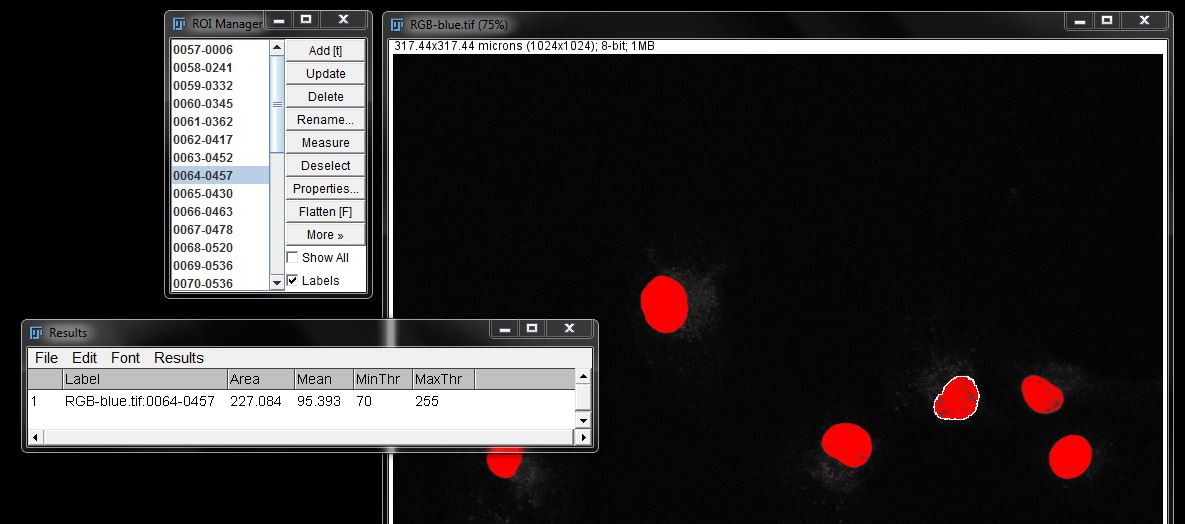
Note: Remember that intensity measurements can't be made from a mask. To perform intensity measurements using this method, you should maintain a threshold before creating ROIs (as shown here) or you can overlay or redirect the ROIs created with a mask to a copy of the original image.