PART 3: MASKS AND FILTERS
Creating thresholds and masks and applying filters forms the basis for a number of analysis methods. This section outlines the various options for masks and filters and how to apply them to your images prior to analysis.
The image Nuclei-1.tif and the image set ‘RGBstackProjection, RGB-blue, RGB-green and RGB-red’ are used for demonstration purposes in this section.
Threshold Image
For a number of basic measurements an image first needs to have a threshold applied to it.
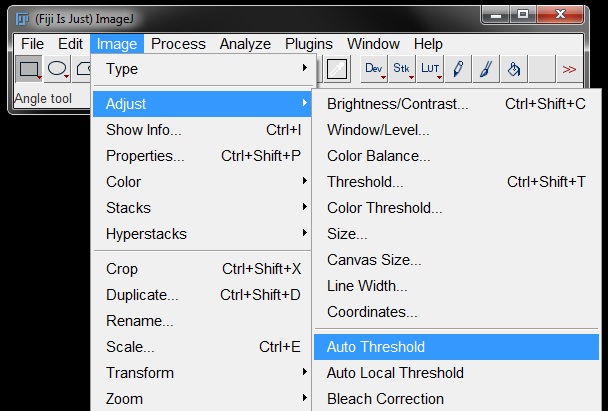
To apply a threshold, select your image and go to Image -> Adjust -> Threshold (or shortcut Ctrl+Shift+T).
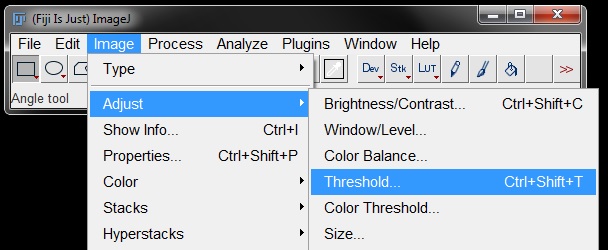
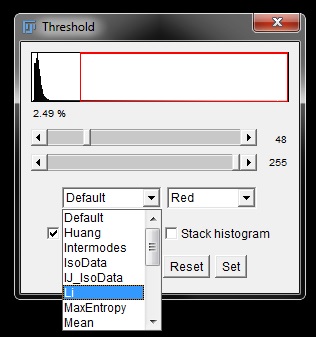
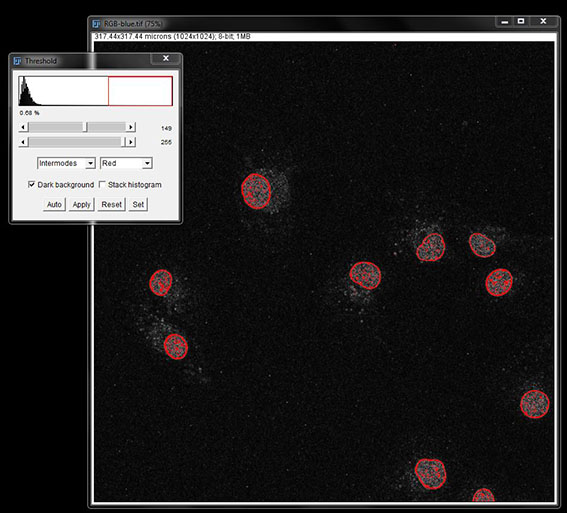
A red overlay will be placed on the parts of the image that are selected by the threshold and a window will open where you can adjust the threshold on the image. In the window that opens, ensure the box beside Dark background is checked for fluorescence images.
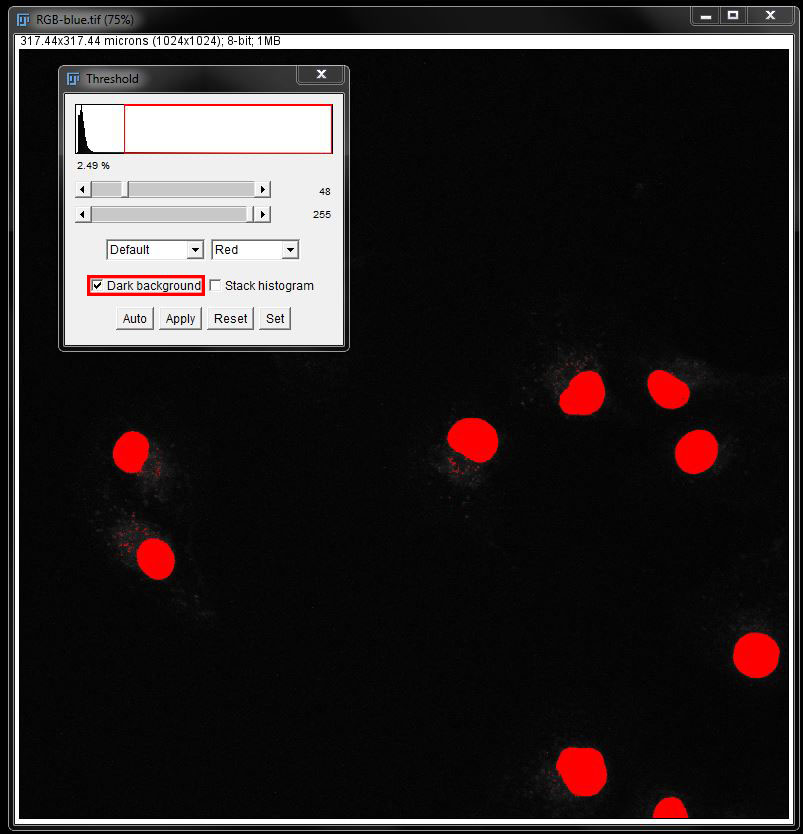
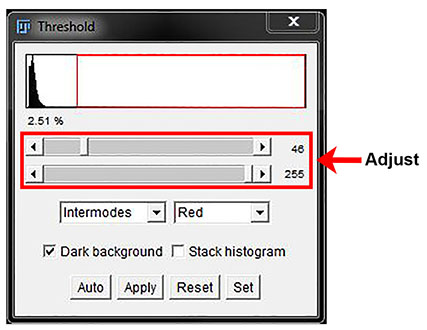
The drop down box on the left (the one that says 'Default' in the image above) has 16 different auto threshold algorithms to choose from. Choose the threshold that looks liek the best fit for your data then further adjust by moving the sliders above. The top slider sets the bottom range of the threshold and the bottom slider adjusts the top range of the threshold. The red box on the histogram shows which parts of the histogram are being thresholded.
Rather than manually adjust, you can also select your algorithm and use the Auto button to allow the program to adjust the threshold levels for you.
Reset will remove any overlayed threshold and allow you to begin again.
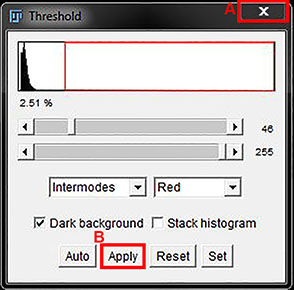
When you are happy with the selection (ie: the red covers the parts of the image you want selected well, without any additional background), close the threshold box to keep is as a threshold only (A in the image below), or click Apply (B in the image below) then close the threshold box to convert it to a mask. (Note: there will be more details on masks and binaries in the next sub-section).
You can also automatically test the range of threshold algorithms on your image without scrolling through the dropdown list one at a time.
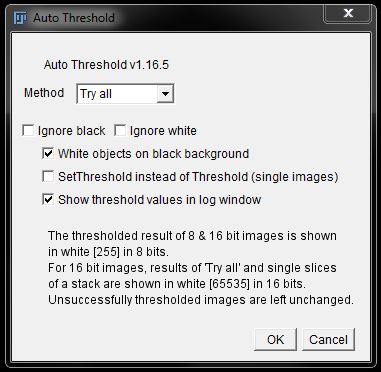
To use the auto-test for thresholds, go to Image -> Adjust -> Auto Threshold.
In the dialog box that opens up set the Method to Try All, make sure the White objects on black background (for fluorescence images) and Show threshold values in log window boxes are ticked. Press OK.
A montage will be generated showing what each auto threshold algorithm would produce on the image. The list in the log that was created will show the order of the algorithms used in the montage.
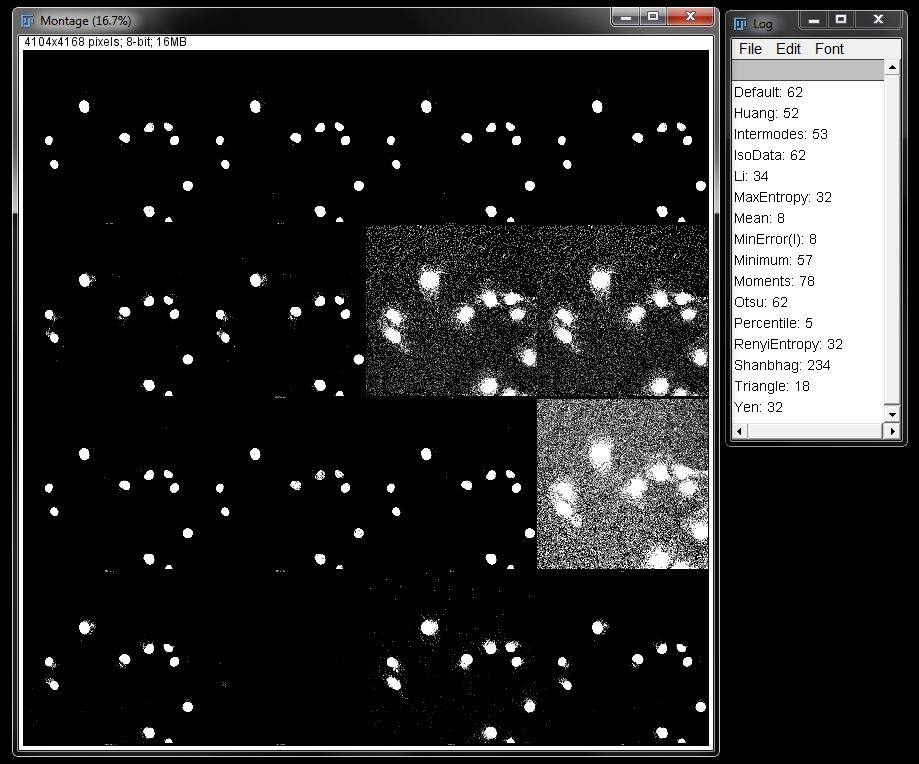
From this montage you can decide which algorthim may suit your data the best and apply it using the steps above.
Creating a Mask
If you need to convert your threshold to a mask, or binary, there are several options you can use. As shown above, if you select Apply in the threshold window it will convert the threshold to a mask.
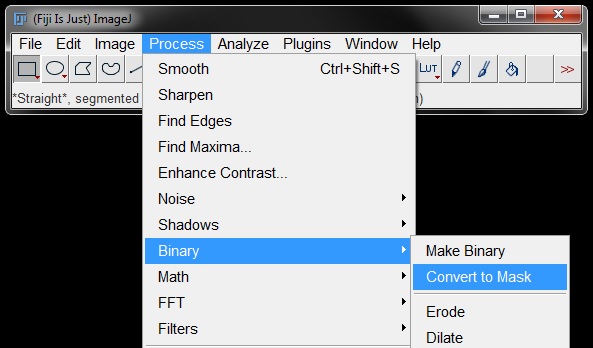
You can also go to Process -> Binary -> Convert to Mask.
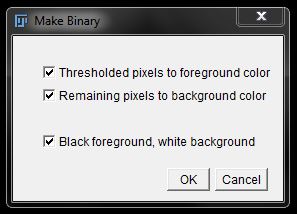
To generate a binary go to Process -> Binary -> Make Binary.
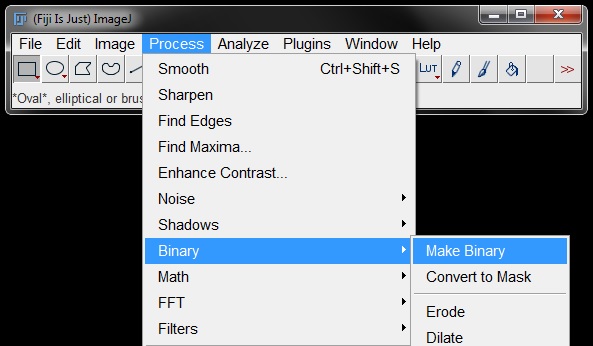
For this option, a window will open with binary options, select your options and click OK to generate the binary image.
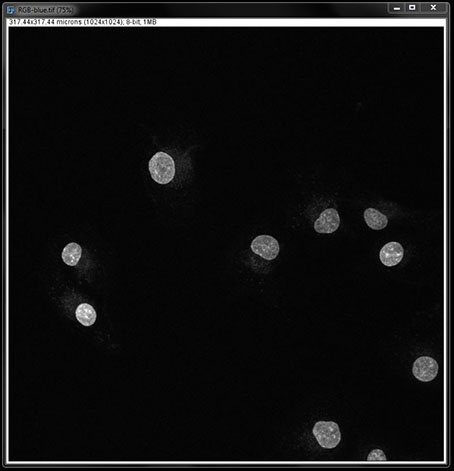
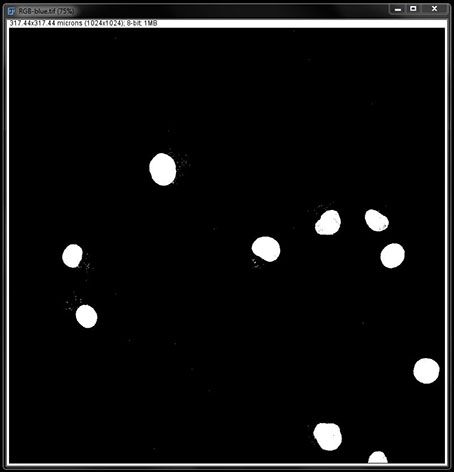
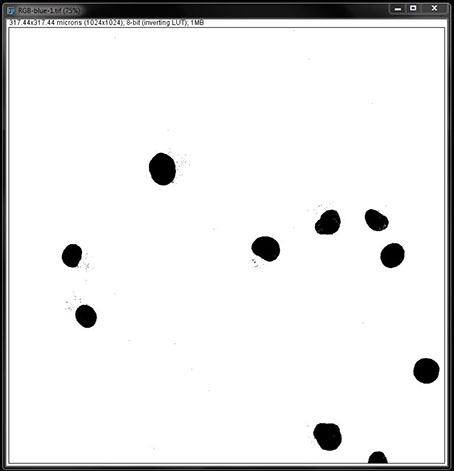
Generally masks and binaries will appear as shown in the images below. However, depending on your settings (both the general settings in FIJI, and those selected from the binary options above), the background and foreground colours can somtimes be reversed in the mask and binary. Macs will often produce reversed background and foreground colours also.
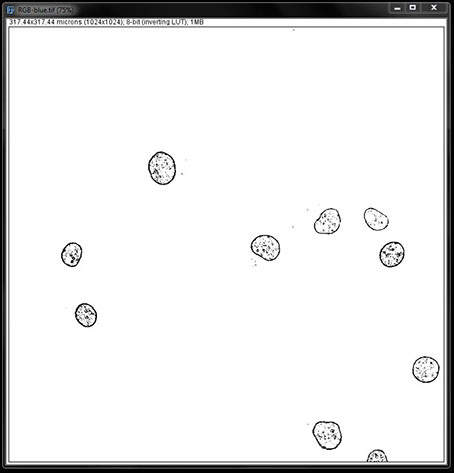
Original Image:
Mask:
Binary:
Making Adjustments to Masks and Binaries
Sometimes adjustments need to be made to binaries/masks before analysis to ensure it is accurately representing the data. There are a number of tools available to help you get the best fit to your data. All of these tools can be found under Process -> Binary.
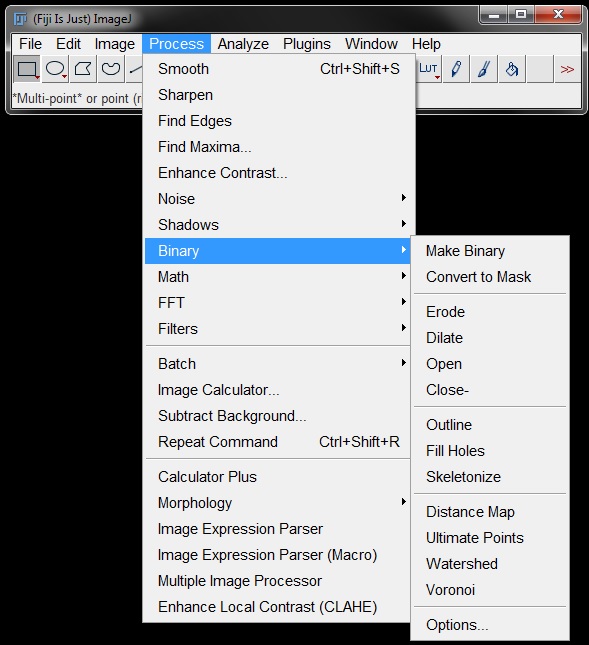
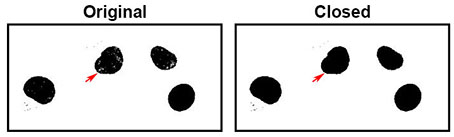
Small gaps left in the mask or binary after thresholding can easily be corrected for by using the Close tool.
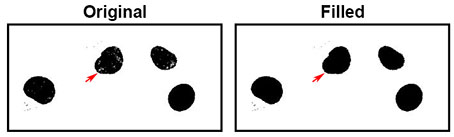
Similar to this is Fill Holes.
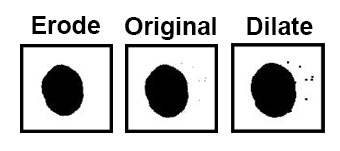
Sometimes you will need to add or remove a small layer from the edges of the mask/binary. This could be useful for things like membrane measurements or morphology analysis.
To add or remove from the edges of a mask or binary you can use the Dilate or Erode tools. Dilate will add a thin layer (1 pixel) around the edge of the existing mask/binary. Erode will remove a thin layer (1 pixel) from around the edge of the mask/binary.
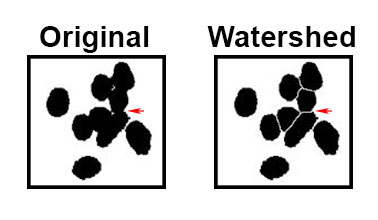
Sometimes separate objects in your image will be touching. When you create a mask/binary of these they will appear as a single object. This can be a problem for some types of analysis, such as counting. But you can use the Watershed tool to detect and separate these objects so they can be counted as individual objects again.
Note: It is important to remember that all of these adjustments will always work on the "black" park of the image so keep this in mind if your colours are reversed.
Clear Inside/Outside
Clear inside and outside can also be useful for adjusting your masks or binaries before making measurements. Sometimes there can be small blemishes in your image that effect your measurements. Or you may want to focus your measurement on a single area of the image. You can crop the image to remove items before analysis, or you can use the clear functions.
Note: We strongly advise against removing objects from images before analysis and publishing of results. Removal of any image information that can alter the outcome can be considered image manipulation. Use these functions with care and caution and always on a duplicated image so that the original remains unaltered.
To use the clear functions you first need to draw an ROI around the area you wish to clear, or keep.
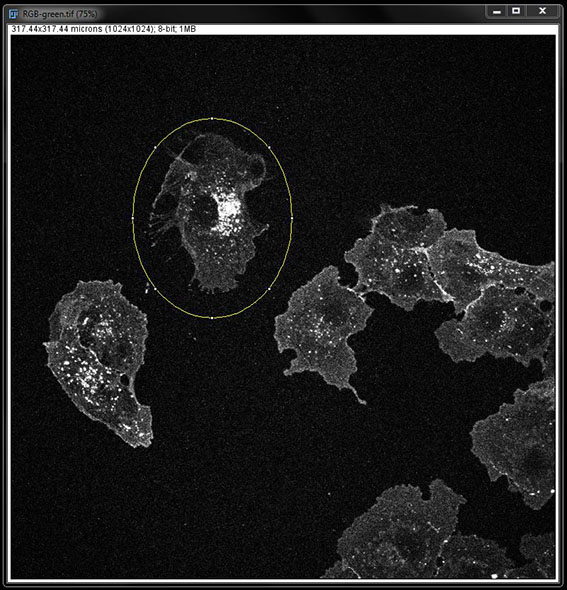
Note: In this example we are using cells for emphasis, but clear functions are usually applied to binaries/masks only to remove blemishes or mistakes from thresholding prior to analysis and we do not recommend removing cells from images in this manner.
Once you have your ROI, go to Edit -> Clear to clear the inside of the ROI.
![]()
![]()
Or use Edit -> Clear Outside, to clear the rest of the image outside the ROI.
![]()
![]()
Image Calculator
Image calculator is another way to select for specific areas where you want to apply your analysis. Image calculator performs arithmetic operations between two images. These can be your original images or stacks, an image/stack and a mask or two masks.
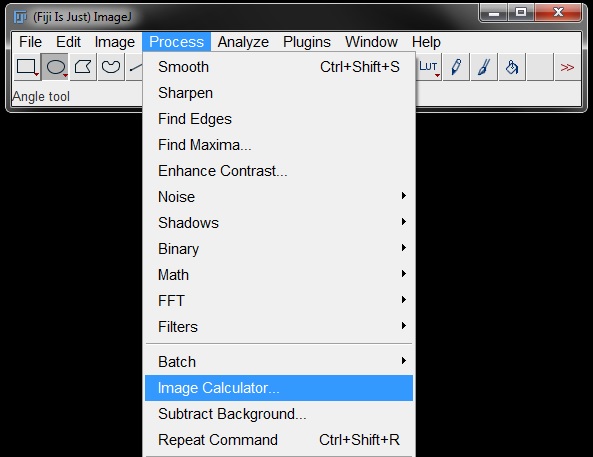
The Image Calculator can be found under Process -> Image Calculator.
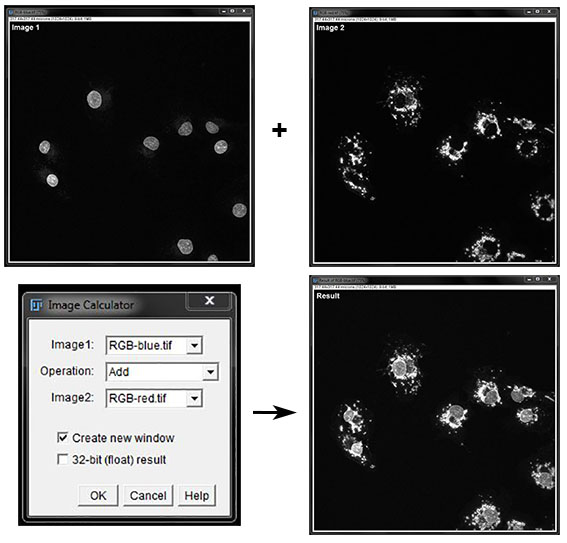
In the resulting window you can select image 1 and image 2 from the drop down menus and choose your operation from the list in the middle. Check the box next to Create new window to generate the calculation as a new image, otherwise it will override image 1.
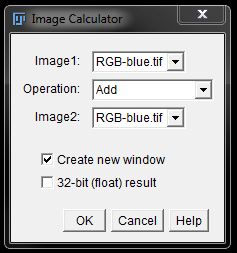
In the image calculator Add creates a new image with the pixels from image 1 added to the pixels from image 2. This is demonstrated below, combining two images into a single image for measurements.
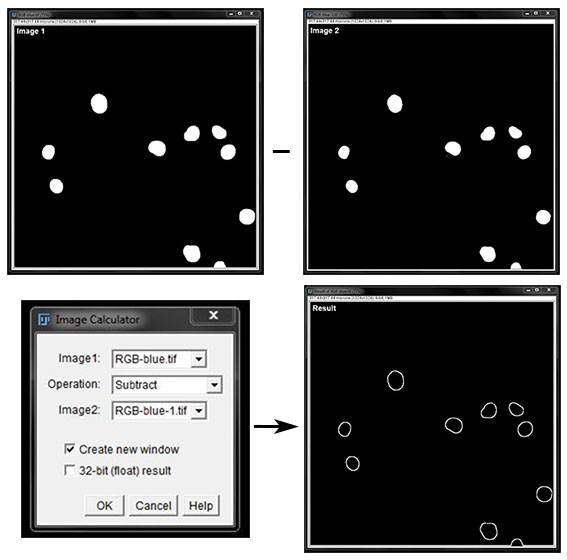
Subtract will remove the pixels in image 2 from image 1. This is demonstrated below with two masks of the same image. The mask in image 2 has been eroded and will be subtracted from the original to leave only the edge of the nuclei for analysis.
You can also use a mask to subtract an area of an image prior to analysis. For example we use the mask of the nucleus here to subtract pixels from the green channel so only cytoplasmic signal remains for analysis.
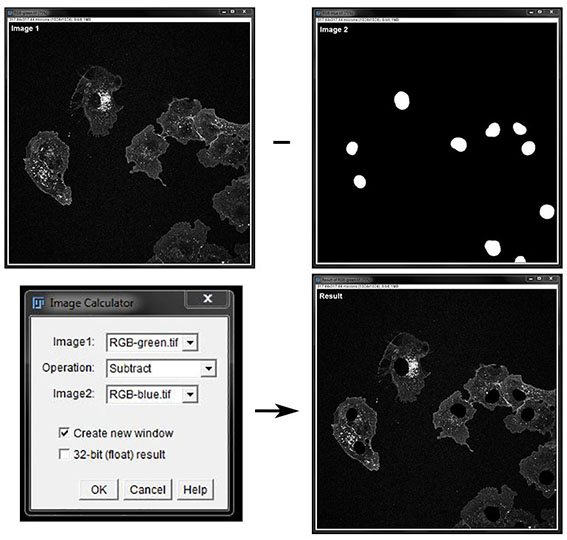
Image calculators can be useful in a number of different analysis techniques. Although not all examples can be shown here, they are worth taking some time to explore as a part of your image analysis.
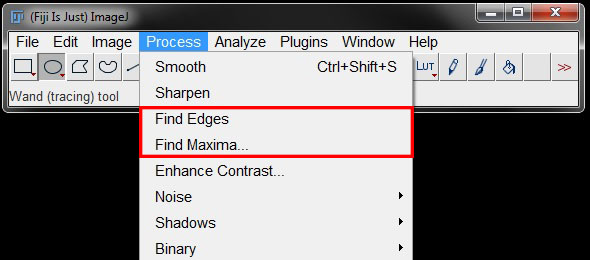
Find Edges and Find Maxima
The Find Edges and Find Maxima tools can help you segment your images. Both of these tools can be found under the Process menu.
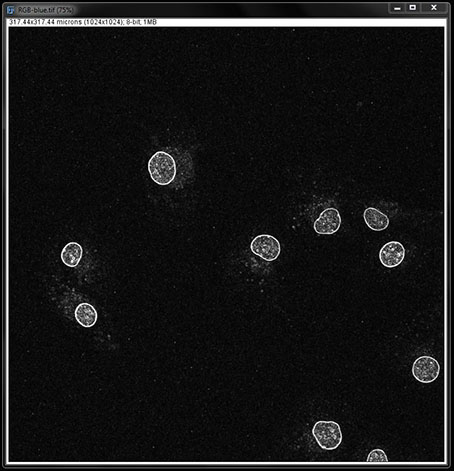
To segment the edges of your image, select the image and then select Find Edges. FIJI will ‘outline’ the edges of the signal in your image.
You can then threshold this image to select edges of the signal only.
Once you are happy with the threshold, click Apply or create a mask or binary as previously shown.
Find Maxima is particularly helpful for segmenting images of dense cell populations or objects.
Select your image and the go to Find Maxima.
In the options window, select the box next to Preview point selection to see the default settings. These default settings will create a dense selection. Ensure Exclude edge maxima is selected.
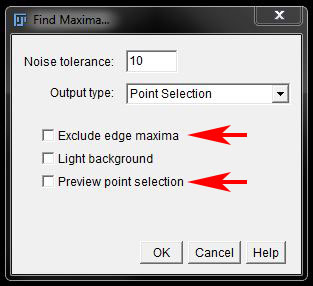
Increase the Noise tolerance to reduce the point selection range on the image. For segmentation, 1 point per cell is ideal. Ensure that Preview point selection is still ticked on, then adjust the Noise tolerance to best fit your data. For segmentation, select Segmented Particles from the drop down list under Output type.
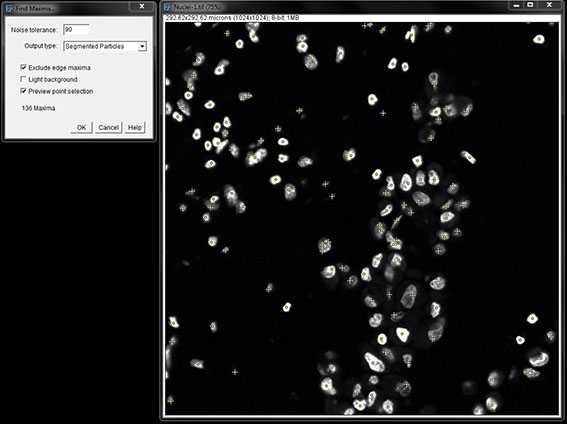
When you are happy with your selection click OK to generate a segmented image mask.
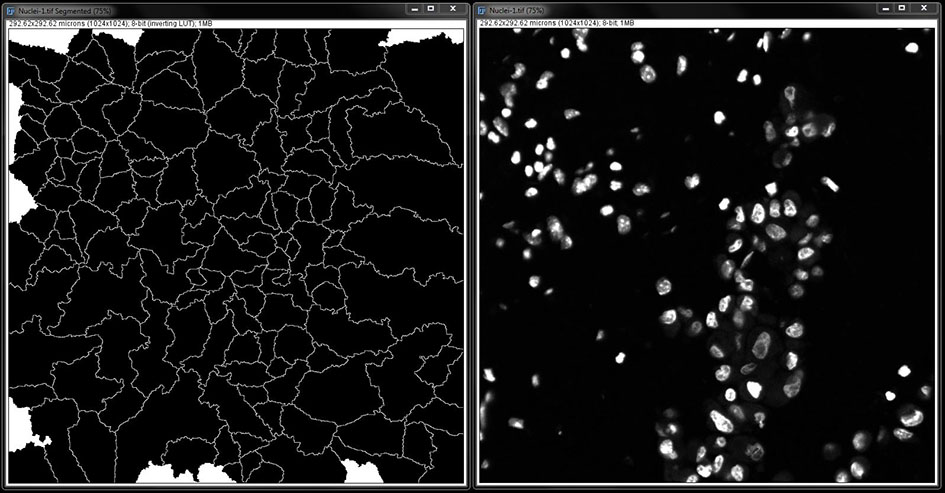
This mask can be used in combination with cell stains to segment and measure individual cells.
Image Filters
Filters can be used to “smooth” your images before analysis. These are another helpful tool for removing blemishes or ensuring that your mask fits the data before analysis.
As with a lot of functions used to aid analysis, filters should be used with care and caution so as to not manipulate the outcome of the data. Filters should only be applied to allow the best fit to the image and not to force the image to fit a preconceived idea. Filters should never be used to alter or enhance images for publication purposes and should be applied prior to analysis ONLY to ensure accurate selection of data and NEVER to remove or enhance any feature that will alter the analysis result.
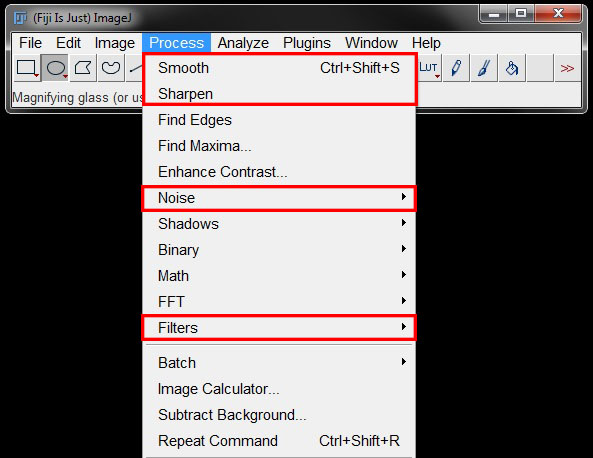
You can find some filters directly under the Process menu. Others are found under Process -> Noise or Process -> Filters.
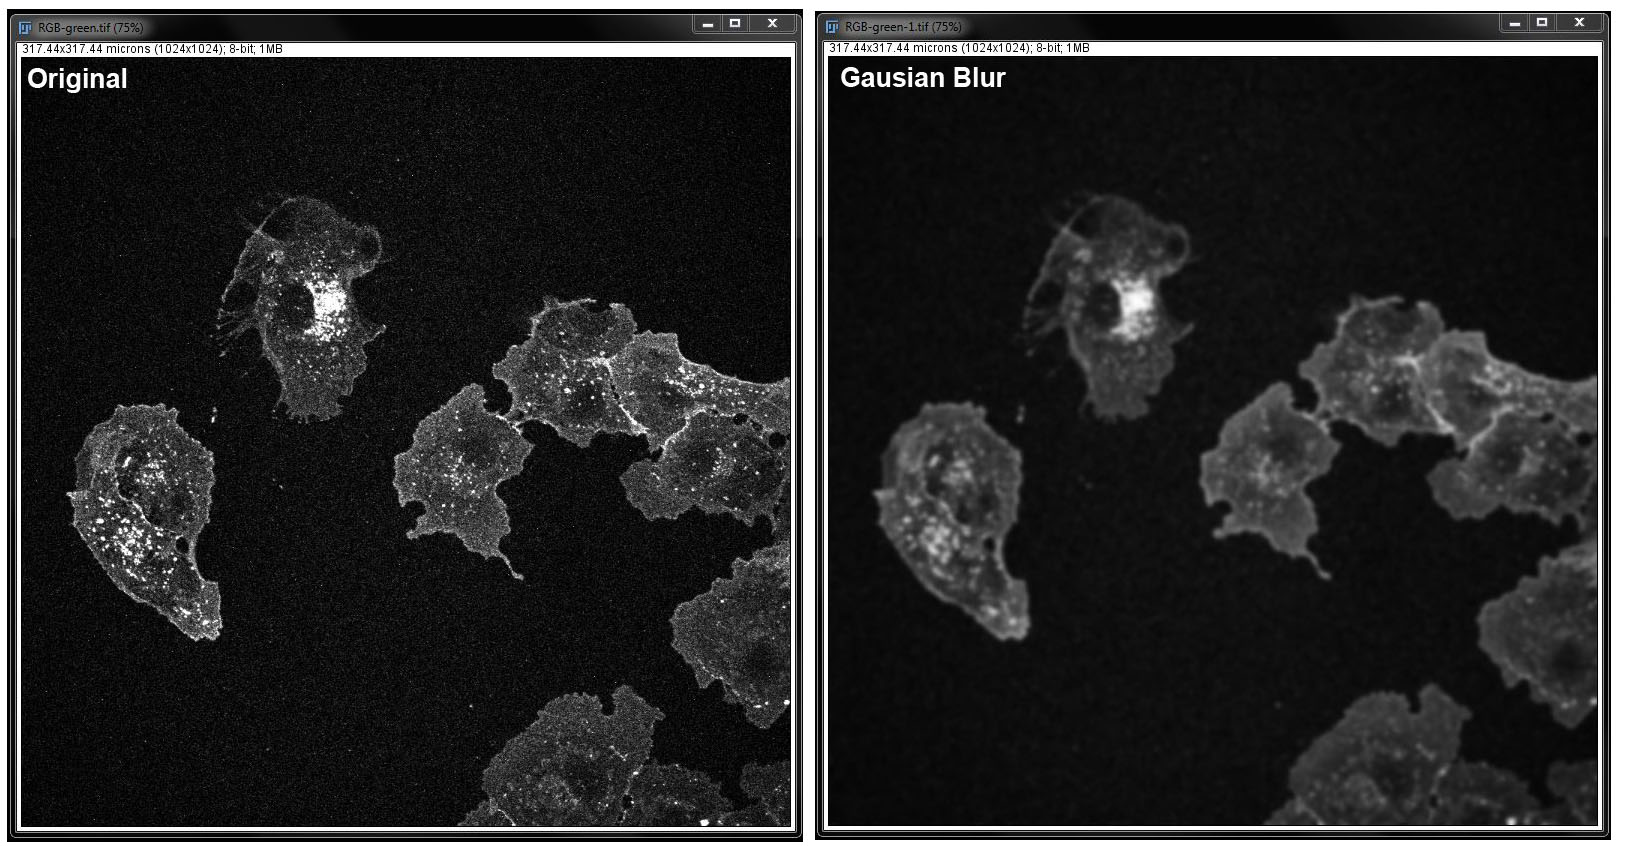
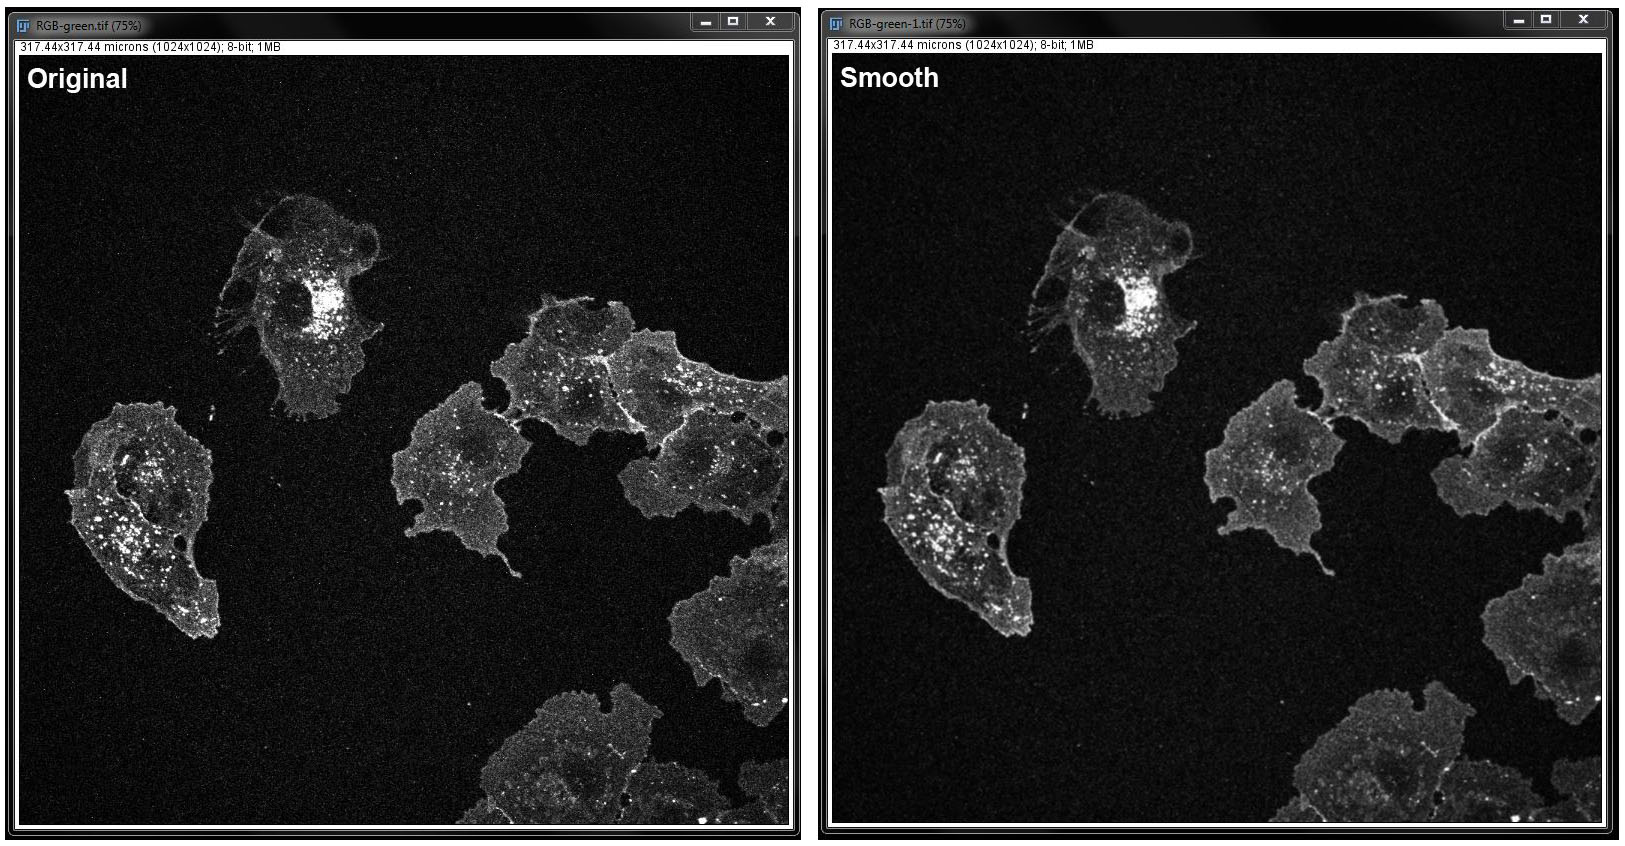
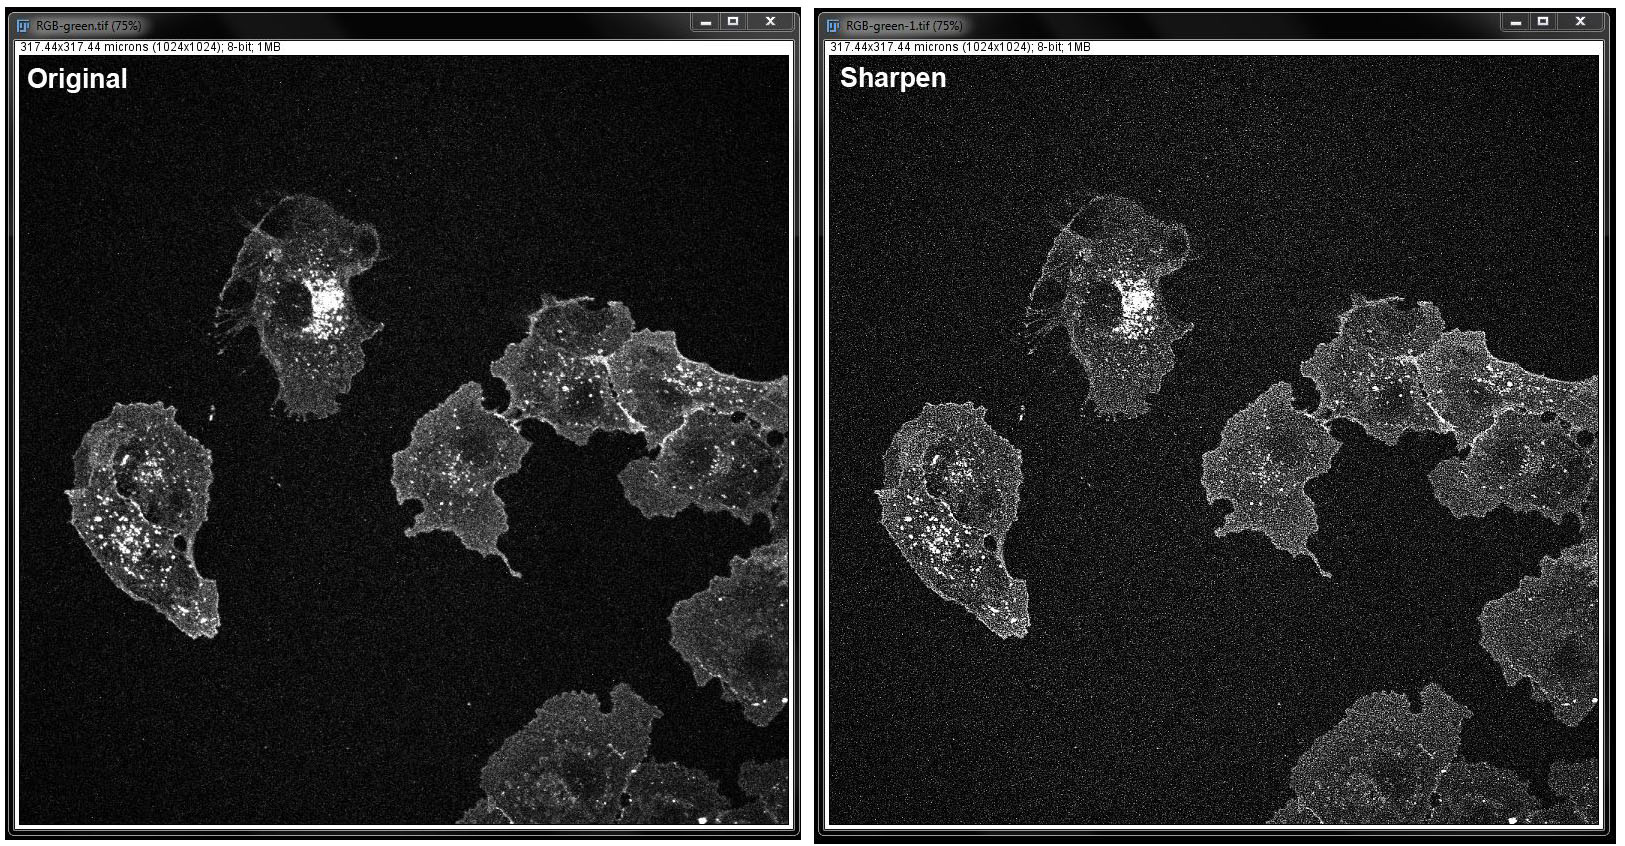
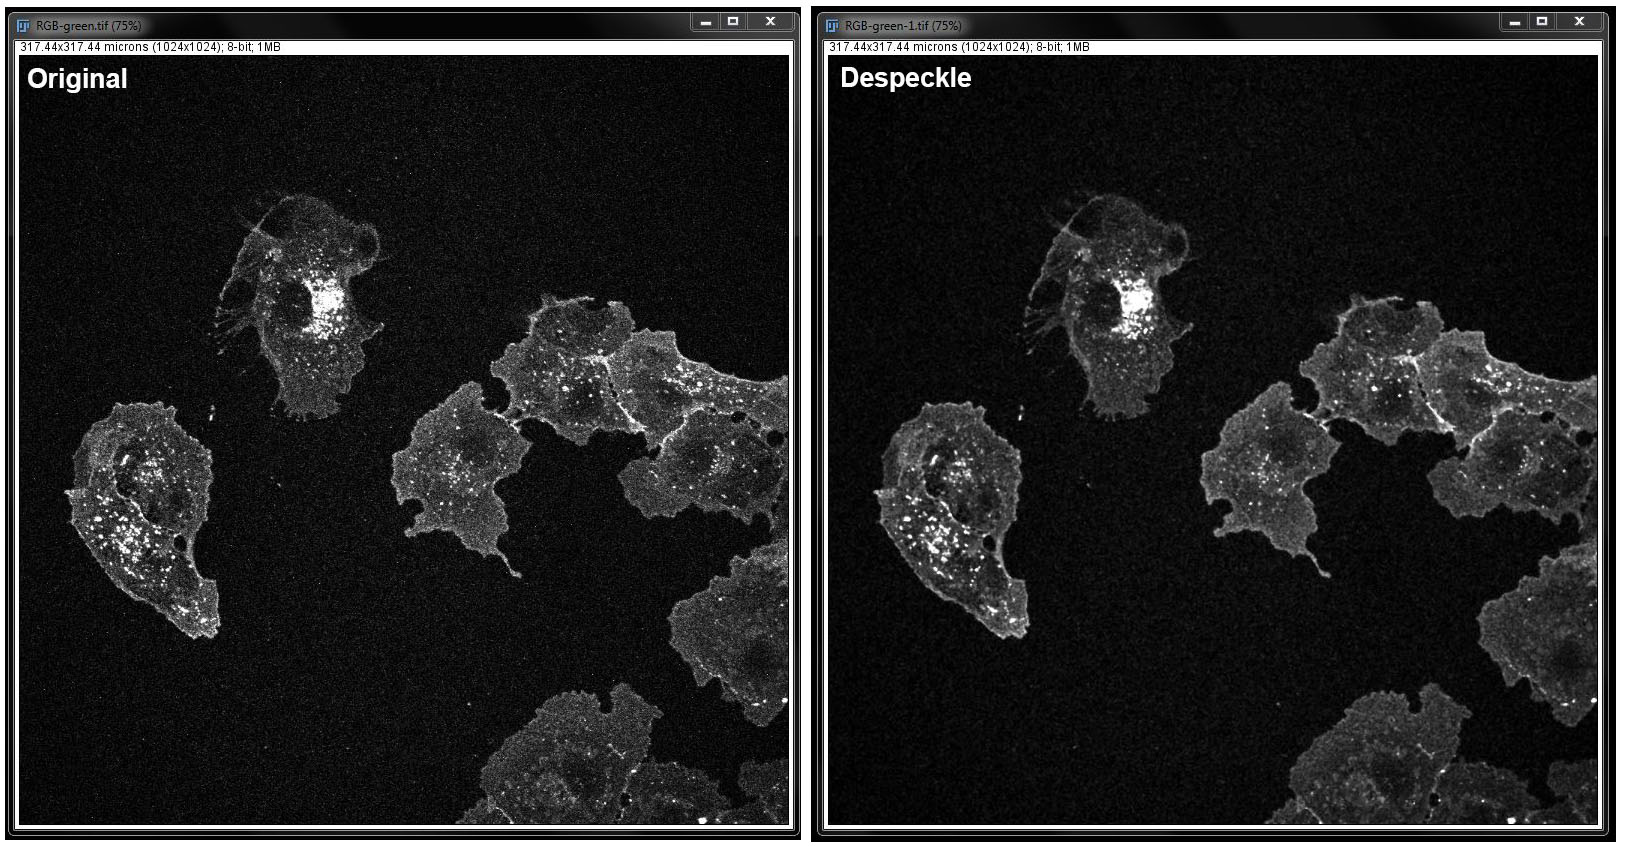
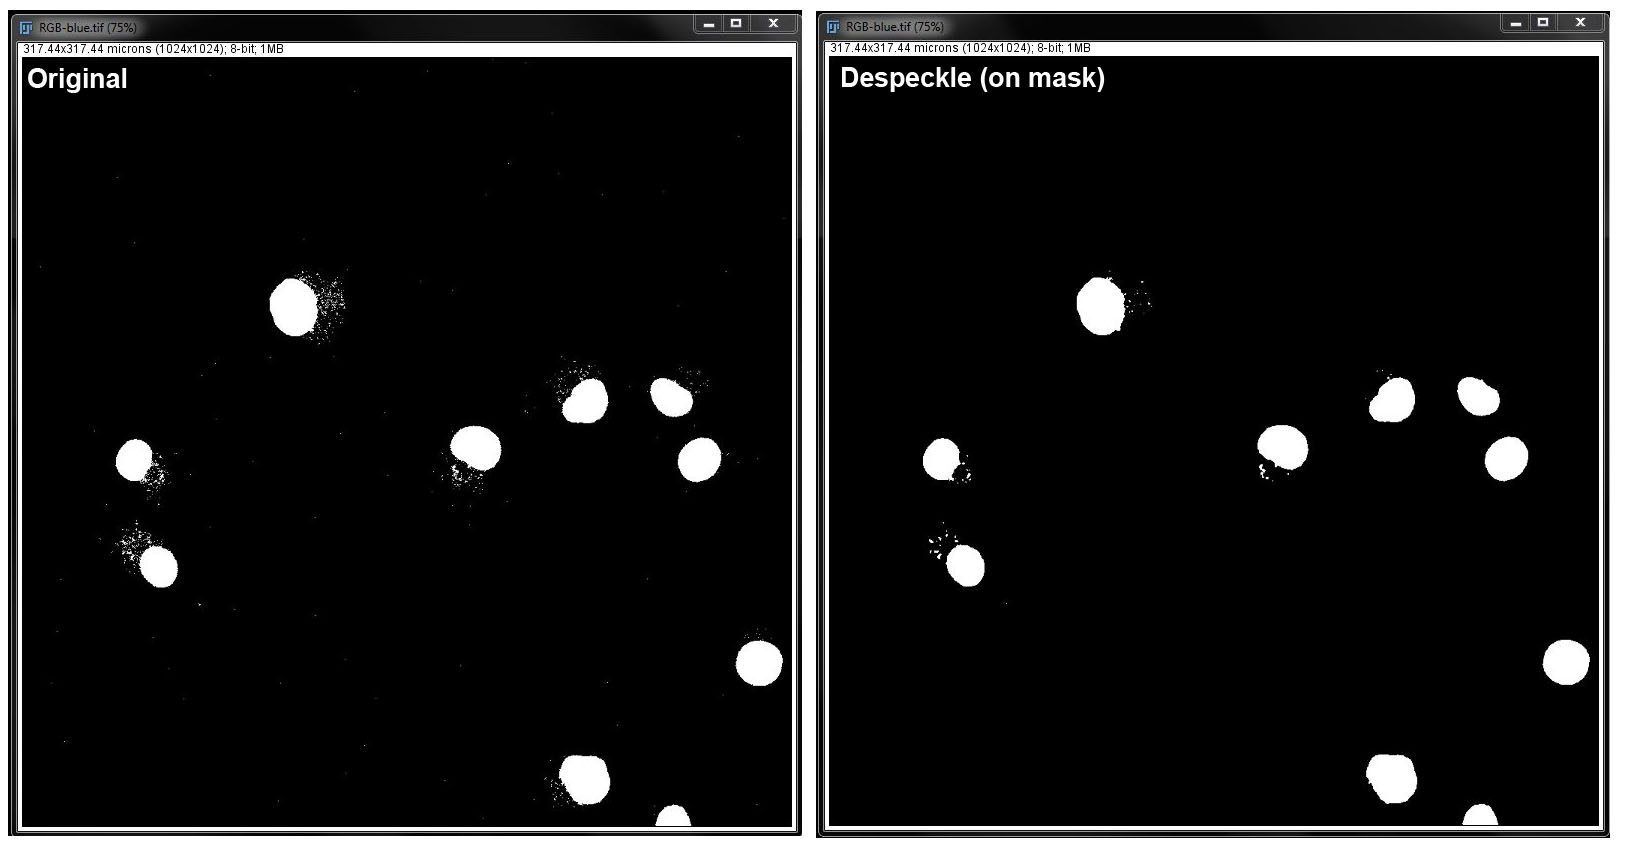
The different filters are demonstrated below with before and after images
Smooth:
Sharpen:
Despeckle:
Despeckle (mask):
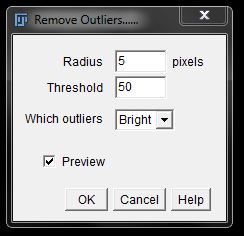
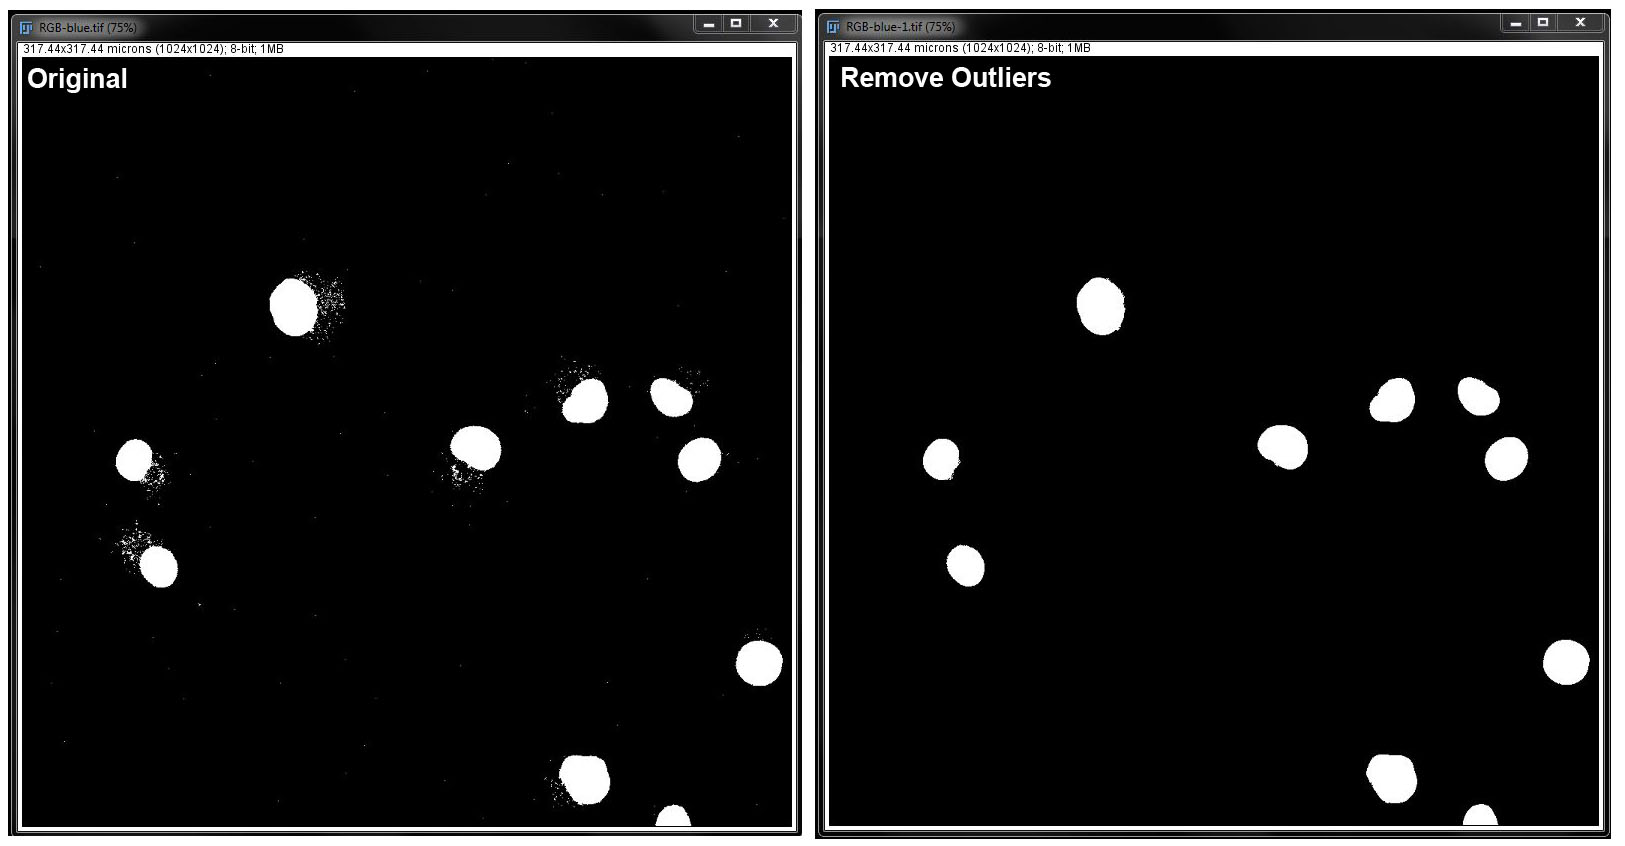
Remove Outliers:
In this filter, you need to specify the outlier radius in pixels, and threshold. Select the checkbox next to Preview to see the changes before you apply them to the image. Click OK when you are happy with your changes.
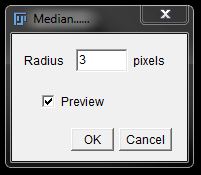
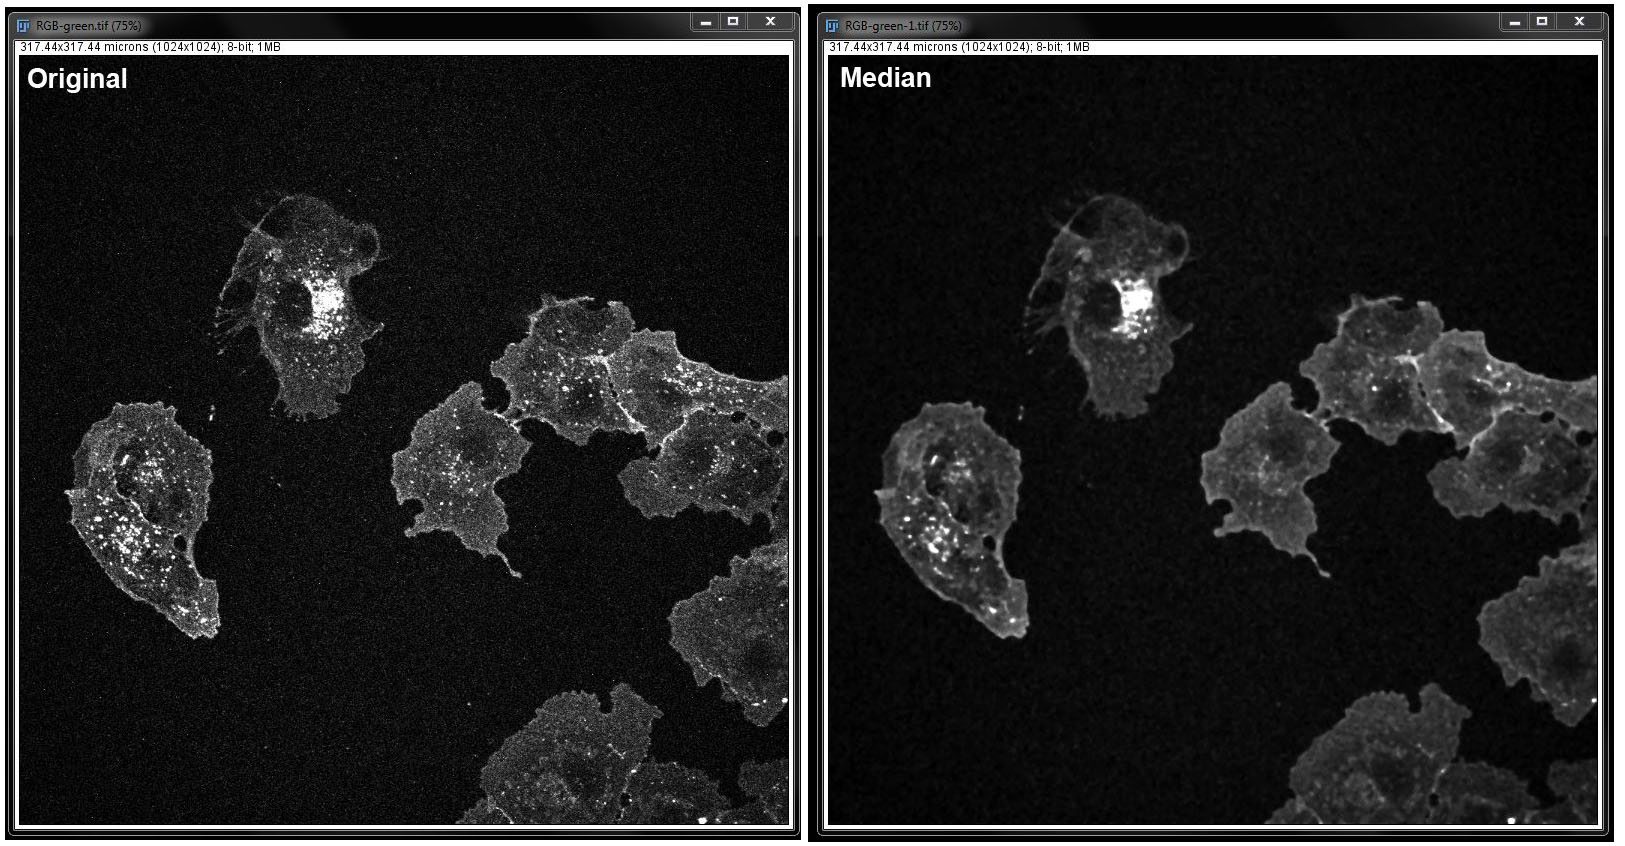
Median:
Again, in this filter, you need to specify the radius in pixels. Select the checkbox next to Preview to see the changes before you apply them to the image. Click OK when you are happy with your changes.
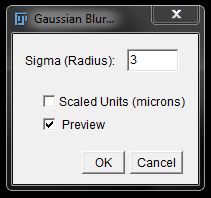
Gaussian Blur:
This filter uses convolution to produce a smoothing effect. Here you again, need to specify the radius. Select the checkbox next to Preview to see the changes before you apply them and click OK when you want to apply changes to the image.